Join the movement to make the geologic table logical again.
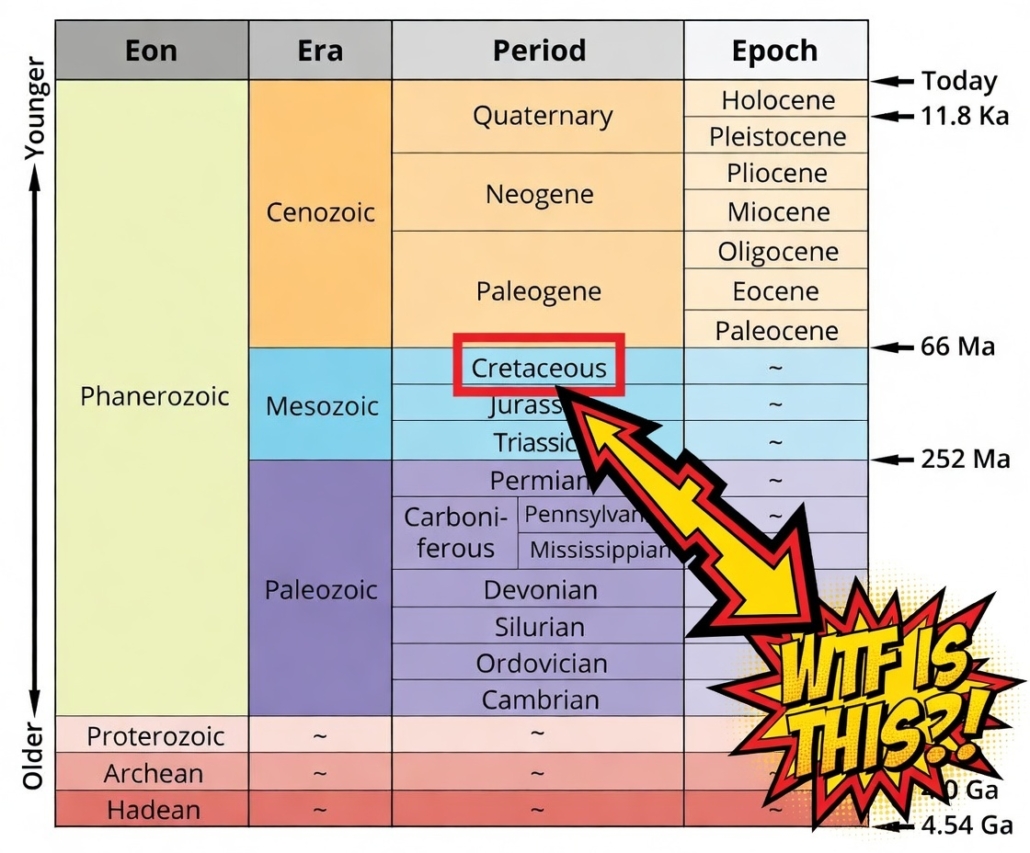
Look, I’m not saying the International Commission on Stratigraphy is incompetent—just that they clearly got lazy around 145 million years ago. Every other period in the geologic column has its shite together. Cenozoic? All “-ocene” endings: Eocene, Oligocene, Miocene—like a biglove Utah family reunion where everyone’s name ends in the same vowel sound. Paleozoic? “-ian” gang: Cambrian, Ordovician, Silurian, Devonian, Permian—sounds like a medieval council of Scottish/Gaelic wizards arguing over how to pronounce the name John. Even the Mesozoic’s got a rhythm: Triassic, Jurassic—clean, punchy, “-sic” like they’re all skater buddies doing the same tricks.
Then comes Cretaceous.
…Cretaceous!
It’s the geologic equivalent of showing up to a black-tie gala in cargo shorts and flip-flops. No suffix. No flair. Just… “Cretaceous.” Like someone forgot to hit “save” on the naming convention. Like someone just didn’t get the memo. And don’t give me that “it comes from Latin creta, meaning chalk” excuse—chalk’s great, but so is consistency. Why not Chalksic? Or Cretaic? Hell, even Cretacic would’ve been better than this half-baked orphan Cretaceous.
So here’s my proposal: we rename it the Cretassic Period.
Yes, it sounds ridiculous. That’s the point. The whole point. Because the only way to fix a century-old typo is to lean into the absurdity until it becomes normal. Think about it—people already call it “the Cretaceous” like it’s an expensive type of shell fish that most people are allergic to. We just need one super bowl commercial where a velociraptor yells, “This is the Cretassic era, baby!” and suddenly every kid in third grade is spelling it right.
Imagine the posters:
Cretassic: The Age of Dinosaurs (Now With Proper Suffixes)
Tagline: “Because grammar matters—even when the planet’s on fire.”
Plot? Simple. A rogue paleontologist (played by Ryan Reynolds, obviously) discovers that the ISC’s naming board is secretly funded by Big Chalk conglomerates. He teams up with a sassy psychotic girl who things she’s a T. rex (played by Scarlett Johansson) and a time-traveling geologist (Idris Elba, naturally) to storm USGS headquarters and demand retroactive suffix consistency–on threat of some…thing really bad.
Cue slow-mo shot of the whole team getting out of a hummer in front of the USGS national offices as Scarlett Johansson is seen running a filing cabinet on a dolly labeled “Mesozoic Inconsistencies” into the front door window at full speed. All while wearing her inflatable T-res costume and trying to get up off the ground in a pile of broken glass with stubby little arms that look more like fingers and the other two freaking out a little because they thought she was going to use the door, not run through it.
Cut to courtroom scene:
Judge: “So all this because you wanted to add a -sic?” Reynolds, standing in front of a remorseful Scarlet T-rex, still in the bottom half of her costume: “We want consistency dammit! Something our parents never gave us! Just make it make sense!”
The jury—half geologists, half TikTok influencers—deliberates for three seconds before shouting, “Cretassic!”
Post-credits: a montage of every textbook in the world auto-correcting itself.
And yeah, I know what you’re thinking: “But Lance, isn’t this just pedantry?”
Guys, pedantry is how we got “Pleistocene” instead of “Ice Age.” Precision, and hard-to-pronounce words are sexy. Consistency is hot. And if we can’t trust the geologic timeline to rhyme, what’s next—calling the reverting Pennsylvanian and Mississippian to Carboniferous? If there’s anything American scientists are good at… its consistency. If we dare to defy the imperial unit system… we can change the Cretaceous. And if we don’t… who are we? What are we? Why dont we just give up the metric system?
Besides, think of the merch. “Cretassic” mugs. “I Survived the Cretassic Extinction” T-shirts. A whole line of Cretassic-branded chalk—white, dusty, and now grammatically correct. And best of all… the Jurassic Park Trilogy (or are we on #5 now?) called, ‘Cretassic Park: because we needed one that was scientifically accurate‘.
We could even pitch it to Netflix:
Scene 1: The Naming War Scene 2: The Asteroid That Fixed Everything Scene 3: Cretassic vs. the Quaternary—Who Gets the Last Word?
And look—if the ISC still says no? Fine. We’ll just start calling it Cretassic anyway. Like how people say “gif” with a hard G. Or how we all pretend “aluminum” isn’t spelled wrong. Cultural momentum wins.
So yeah. Petition the ISC. Tweet at them. Spam their LinkedIn. Tell them the Cretaceous is a blight on logic, a stain on stratigraphy, and honestly? A little embarrassing.
Because if we’re gonna spend billions studying rocks, we might as well make sure their names don’t sound like someone sneezed halfway through the word.
Cretassic. Say it. Feel it. Own it. And if anyone asks why we did it—tell them it’s for the children. And for the dinosaurs. And for the sake of not looking like idiots in front of aliens.
https://utahgeology.com/wp-content/uploads/2026/03/cretassic-park-not-jurassic-park.jpg8801184Lance Weaverhttps://utahgeology.com/wp-content/uploads/2025/07/utah-geology-site-logo-420px-new.pngLance Weaver2026-03-02 01:11:162026-03-09 05:45:23The Cretaceous (Cretassic) Period: A Geologic Proposition to the ICS
Raise of the Colorado Plateau (33-15 MYA), and Formation of the Colorado River & Grand Canyon
The Eocene lakes PROVE the timing of the drainage reversal!
Introduction
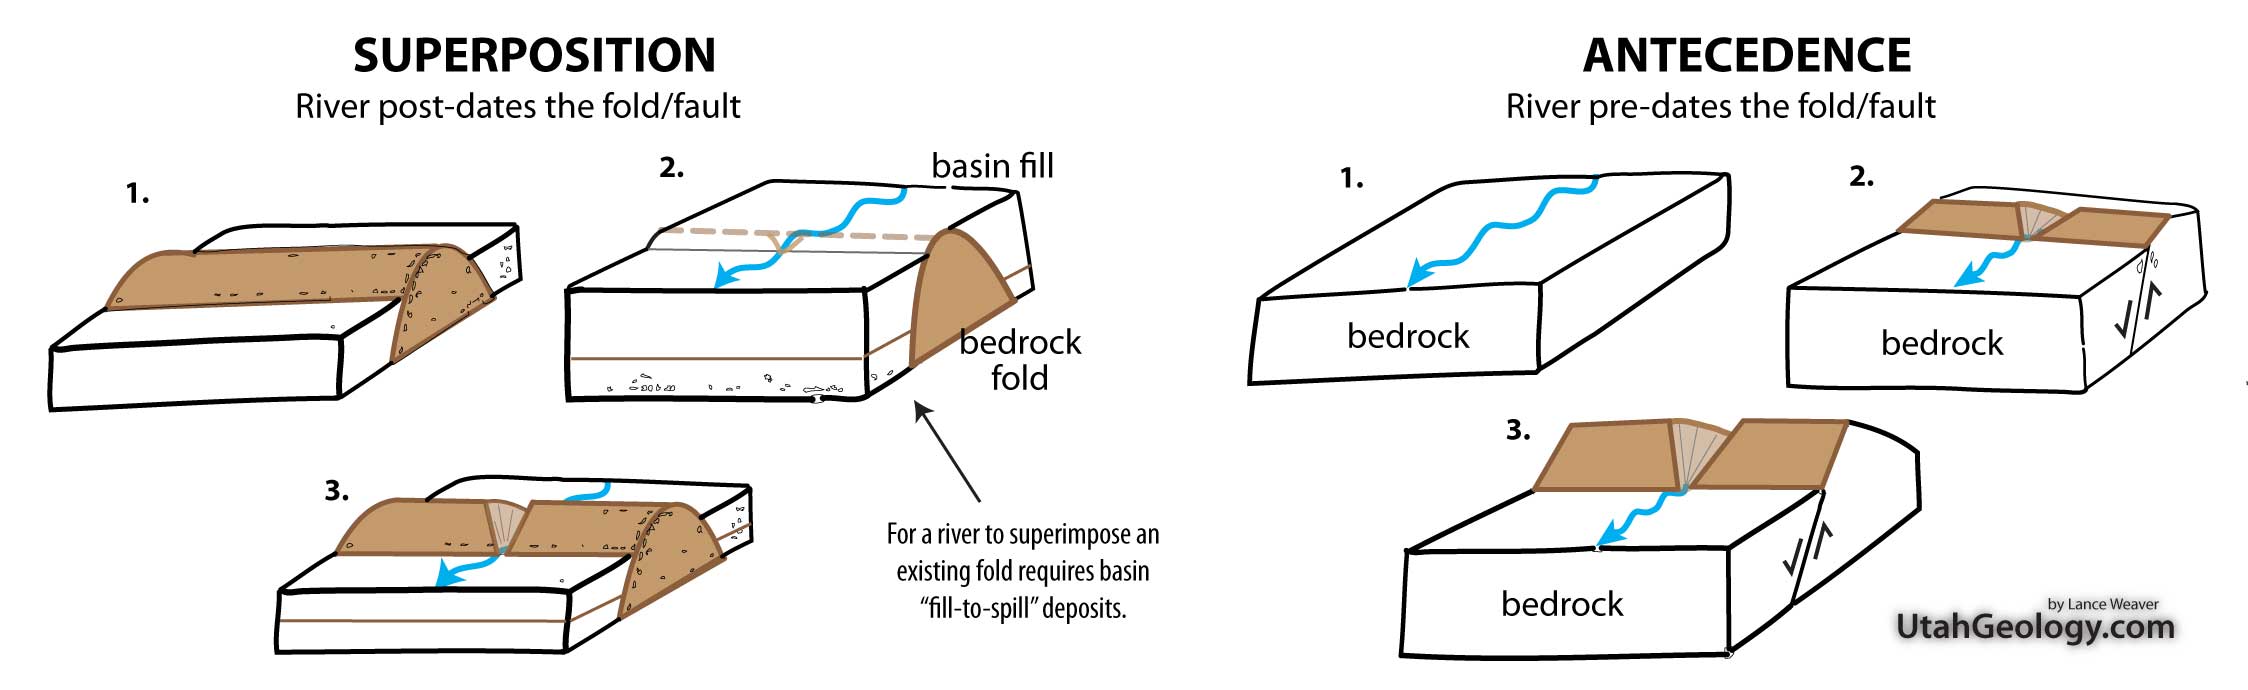
For over two decades, the geologic community has remained locked in a debate regarding the “Old” versus “Young” Colorado River, often missing the forest for the trees. By hyper-focusing on localized datasets—such as the geochemical signatures of the Grand Wash Trough, the Peach Springs Tuff, or the elusive zircon dating of downstream alluvium—researchers frequently ignore the most significant evidence staring them in the face: the relationship between drainage reversal, ponding events, canyon incision and the regional tectonic upwarps. To understand the Colorado River’s evolution, we must prioritize two diagnostic features: the canyons that cut through massive structural folds and the lacustrine (lake) “fill-to-spill” deposits that inevitably accompany major drainage reversals.
Addressing the former first, its important to remember that in all locations which completely lack ANY evidence of large basin fill deposits suggesting a fill-to-spill scenario of fold overtopping– the fold had to pre-date or “antecede” the upwarps of the Colorado Plateau in order to maintain eroding a coarse & canyon through these massive folds as they formed. Let me repeat that. A river HAD TO PREDATE most the major Laramide folds which the modern rivers currently cut through. There is simply no way around it. (Pun intended!). The Colorado River cuts through the Kaibab, Monument, Circle Cliffs, Uinta/Split Mountain, and Uncompahgre uplifts, and its tributaries cut through the Cockscomb, VRG, San Rafael swell and other upwards, with ZERO evidence of basin fill deposits behind the fold in most cases. This strongly suggesting these watercourses were established BEFORE the upwarps began to rise significantly in the Cretaceous & early Tertiary.
This fact alone helps us to ascertain that the river courses through most large folds on the Colorado Plateau are very old. Older than the very folds themselves.
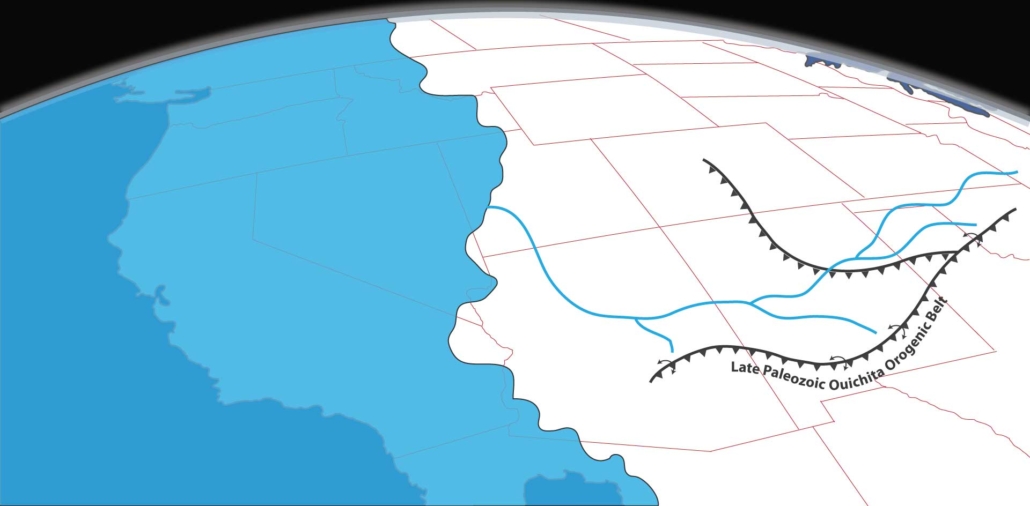
However, it’s also fairly well established that the general drainage in Utah & the Colorado Plateau throughout the Cretaceous & earliest Tertiary was opposite of present, to the NORTH and EAST from the Nevada & Arizona highlands into the retreating Cretaceous seaway, which causes a bit of a puzzle. Much like the fill-to-spill character of a river crossing a superimposed fold, drainage reversal REQUIRES ponding of a drainage as the continental divide passes perpendicularly across the drainage.
The Great Reversal: A Case for the Oligocene Integration of the Colorado River
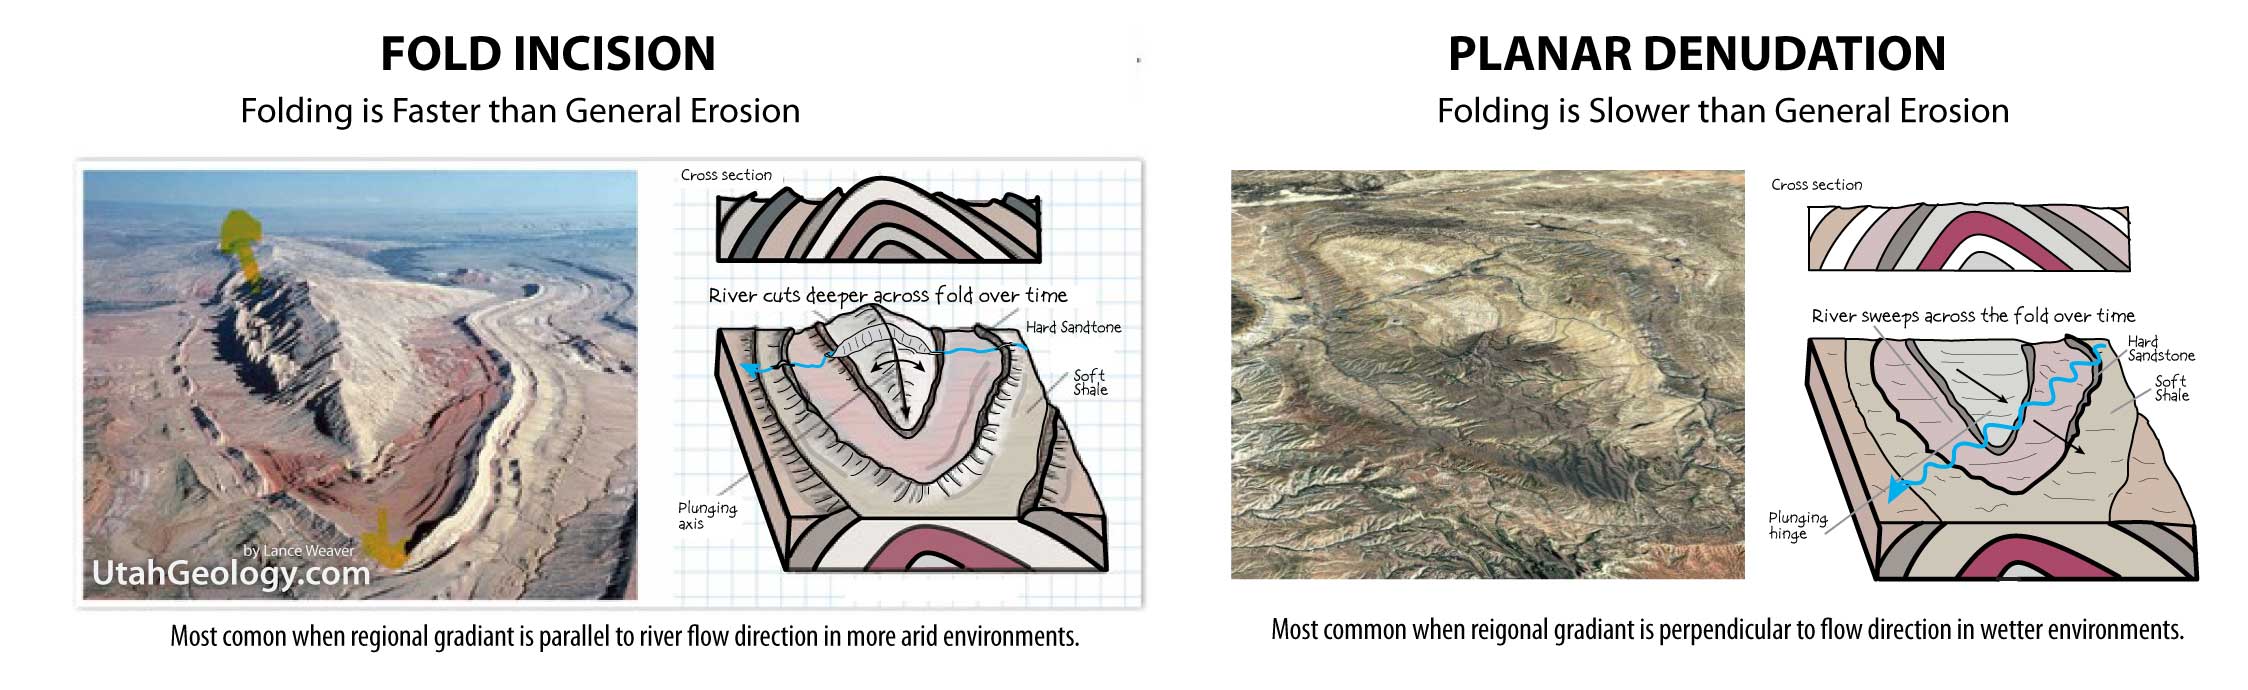
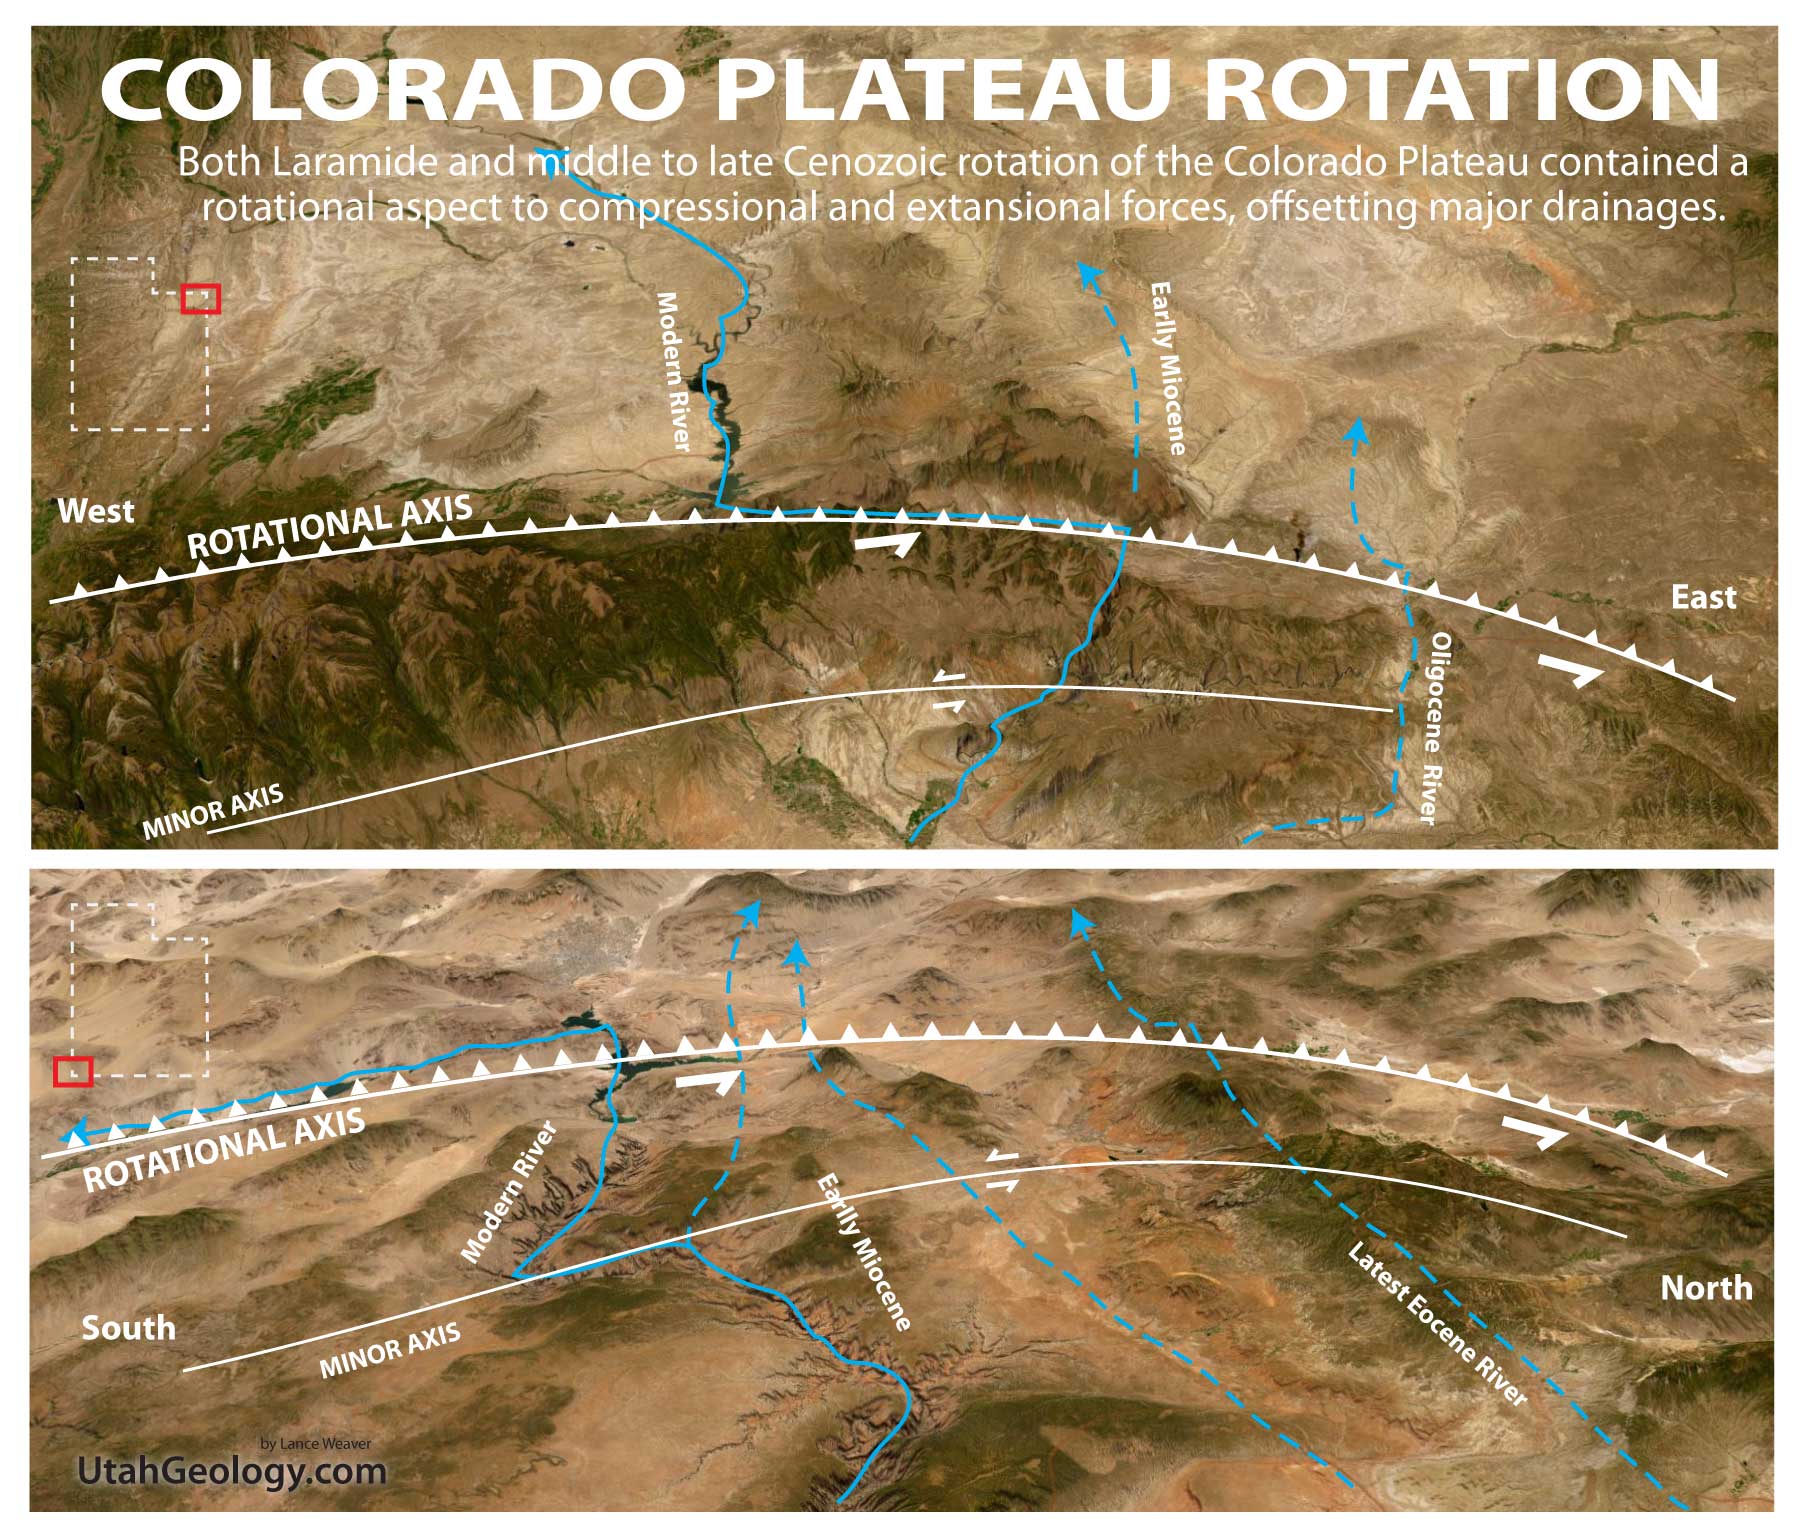
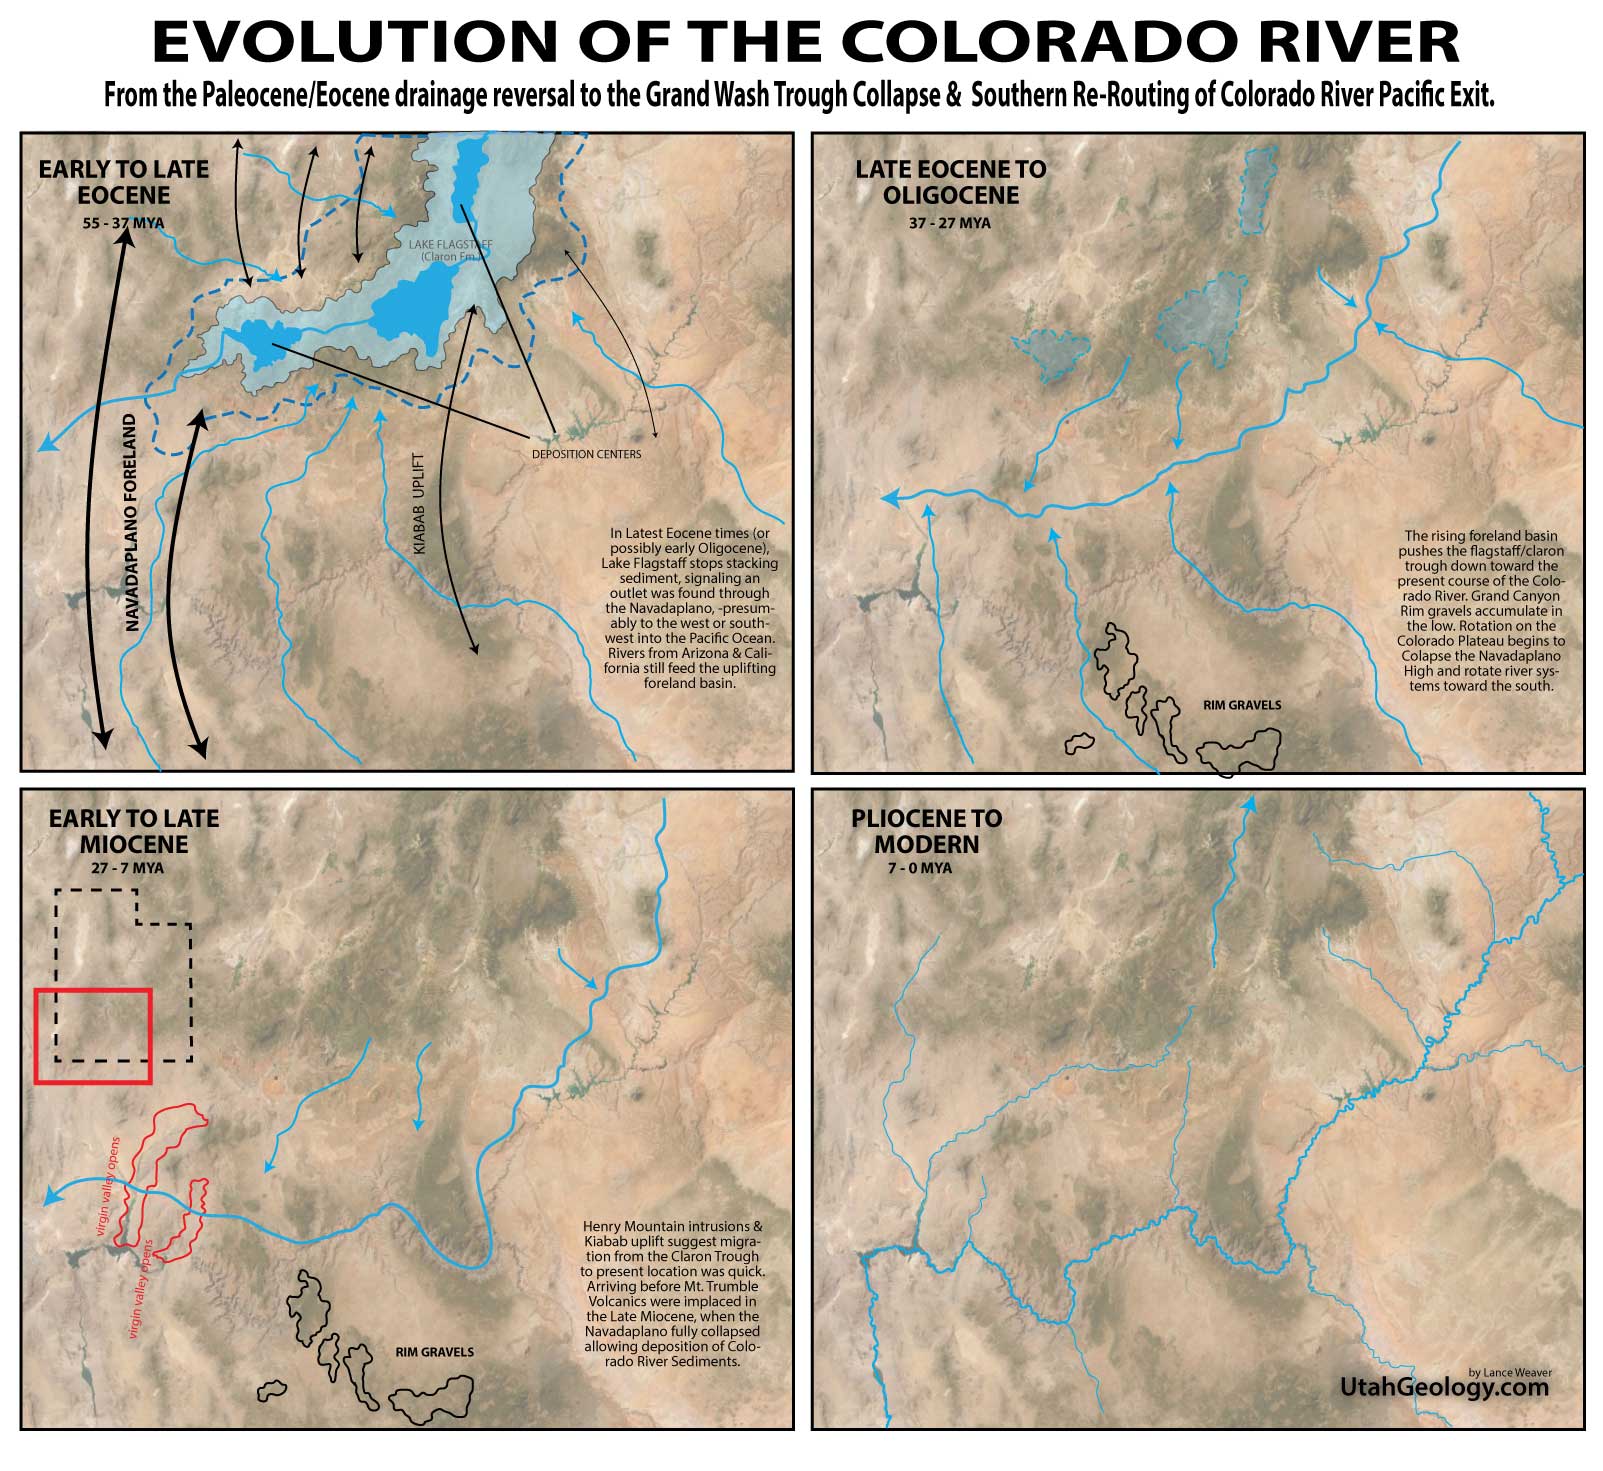
So the question is… where is the ponding evidence for the drainage reversal? Researchers have been looking for ‘reversal deposits’ for decades in regard to the debate on the Colorado River’s evolution. Yet to date, the paltry Bidahochi Formation on the Defiance Upwarp is the only proposed candidate for a Tertiary Lake deposit marking the ‘Great Reversal’. But frankly the obvious answer has been staring us in the face the whole time. The Great Paleocene & Eocene lakes of Utah & Wyoming are the evidence of the reversal & beginning of the Colorado River! It was during the Paleocene & Eocene that drainage reversed from Northeastward flow to Southwestward flow, and the proto-Colorado River established its outlet to the Pacific Ocean through a pass in the Mountains during that time. Much like present Ganges River draining the Tibetan plateau through the front range of the Himalayas. It follows then, that as the Nevadan/Arizonan Arc collapsed in the Mid to Late tertiary, the Colorado River had ALREADY established an outlet to the Pacific, allowing it to maintain courses through canyons of the “Navadaplano” and the gentle folds of the Colorado Plateau. Afterwards, the river was pushed ‘laterally east & southward’ from the centerline of the Eocene lakes to its present location causing ‘planar denudation’ (see figure) of many folds before it settled into its present location and began rapid canyon incision late in the Cenozoic.
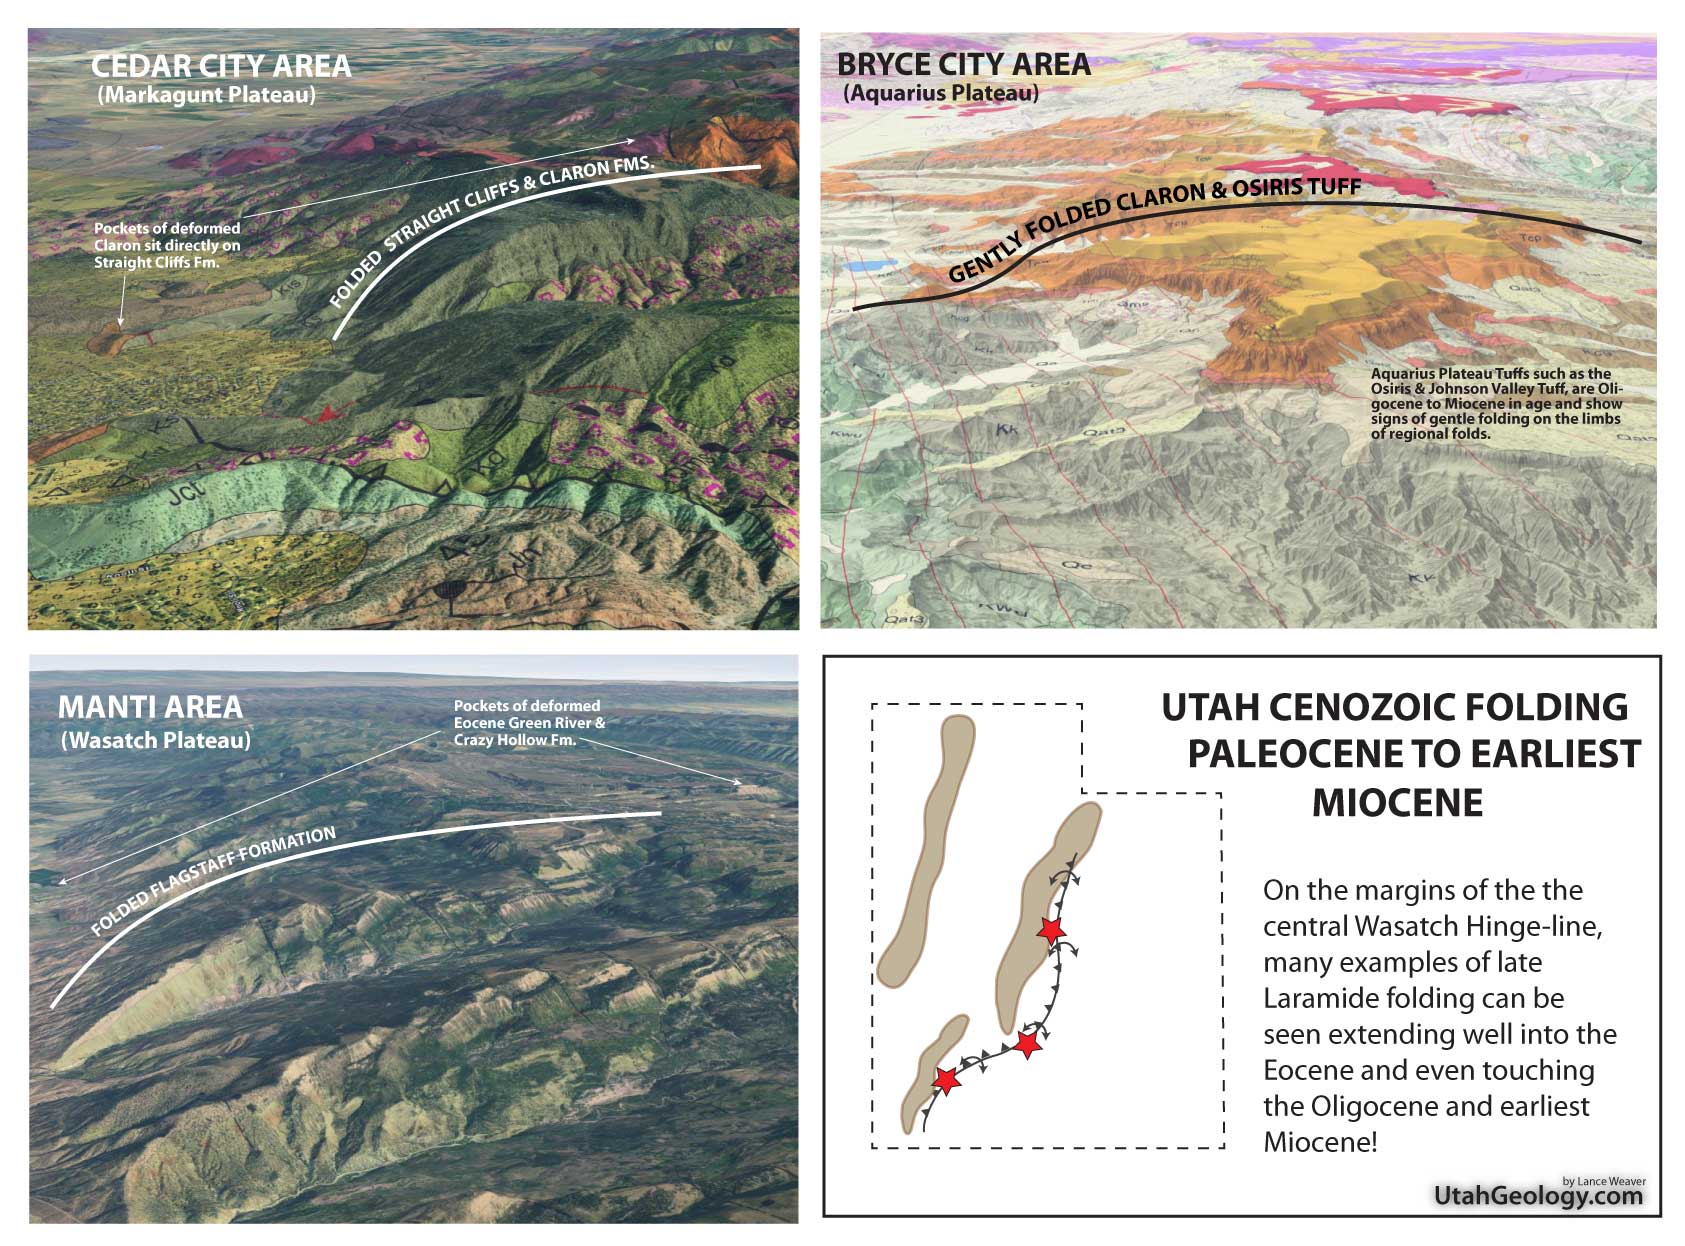
This lateral ‘pushing’ of the river from the west toward the east by eastward migrating Laramide orogenic forces can be clearly seen by the folding of Eocene and Oligocene (and even early Miocene) deposits in central Utah. The steeply folding early Cenozoic deposits on the Wasatch Plateau as well as folding under Thousand Lakes Mountain and Boulder Mountain clearly show that folding persisted at least as late as the Signal Peak volcanic rhyolites (26-25mya) which blanket Boulder Mountain. These eastward migrating fold belts would have pushed the proto-Colorado river from the location of its initial inception (in the center of the filled Eocene lake Uinta & Flagstaff) to it its current location between the dates of around 35mya and 21 mya as constrained by the period Oligocene lakes STOPPED retaining sediment (~35mya) to the time that the Signal Peak Volcanics and Henry Mountain laccoliths were emplaced.
Oligocene Folding and Volcanism
There is a widespread misconception, even among seasoned geologists, that the elevation differential of the west-facing slopes of plateaus like Markagunt Plateau, Pansagunt Plateau, Wasatch Plateau, and the Aquarius Plateaus have somehow been “uplifted” by the Normal Faults that bound their west sides. To the contrary, however, every one of these plateaus are actually remnants of pre-extensional folds. And as already discussed, because many of these folds deform Eocene, Oligocene & even early Miocene strata, they must post-date the 45-23 Ma deposition of that strata. This evidence necessitates that massive folding must POST-DATE 33 Ma and PRE-DATE the the onset of Basin and Range extension around 17–12 Ma. This “window” is a huge, poorly understood, and poorly taught fact in Western geology! This timeframe includes the late deposition of the Browns Park Formation, which was likely being deposited behind deformation of the Uinta Arch. As well as Miocene deposits associated with the Rio Grande rift and the Mesquite Basin north of the Grand Wash Trough– caused by rotation of the Colorado Plateau which I believe was responsible for the initial uplift of the Plateau and obliteration of evidence of the ancient outlet of the pre-extensional Colorado River.
This all fits together because these Colorado Plateau bounding folds are undoubtedly associated with the Plateau’s primary rise and the widespread explosive volcanism of the region. From the massive calderas bounding the Plateau to the intrusive laccoliths and dikes, everything points to a rise dating from 33 Ma to 15–12 Ma when the Basin and Range collapse began. The transition from the marine Cretaceous to the lacustrine Claron and Green River lakes is the biggest clue we have. Furthermore, the age of the massive erosional surface of the clastic apron of Bishop Conglomerate undoubtedly dates a major erosional surface on the Colorado Plateau and its folds. It is well-constrained by ash beds to 34–30 Ma and correlates to the Starr Flat Member of the Duchesne River Formation, marking a massive erosional pulse that followed the plateau’s first great heave.
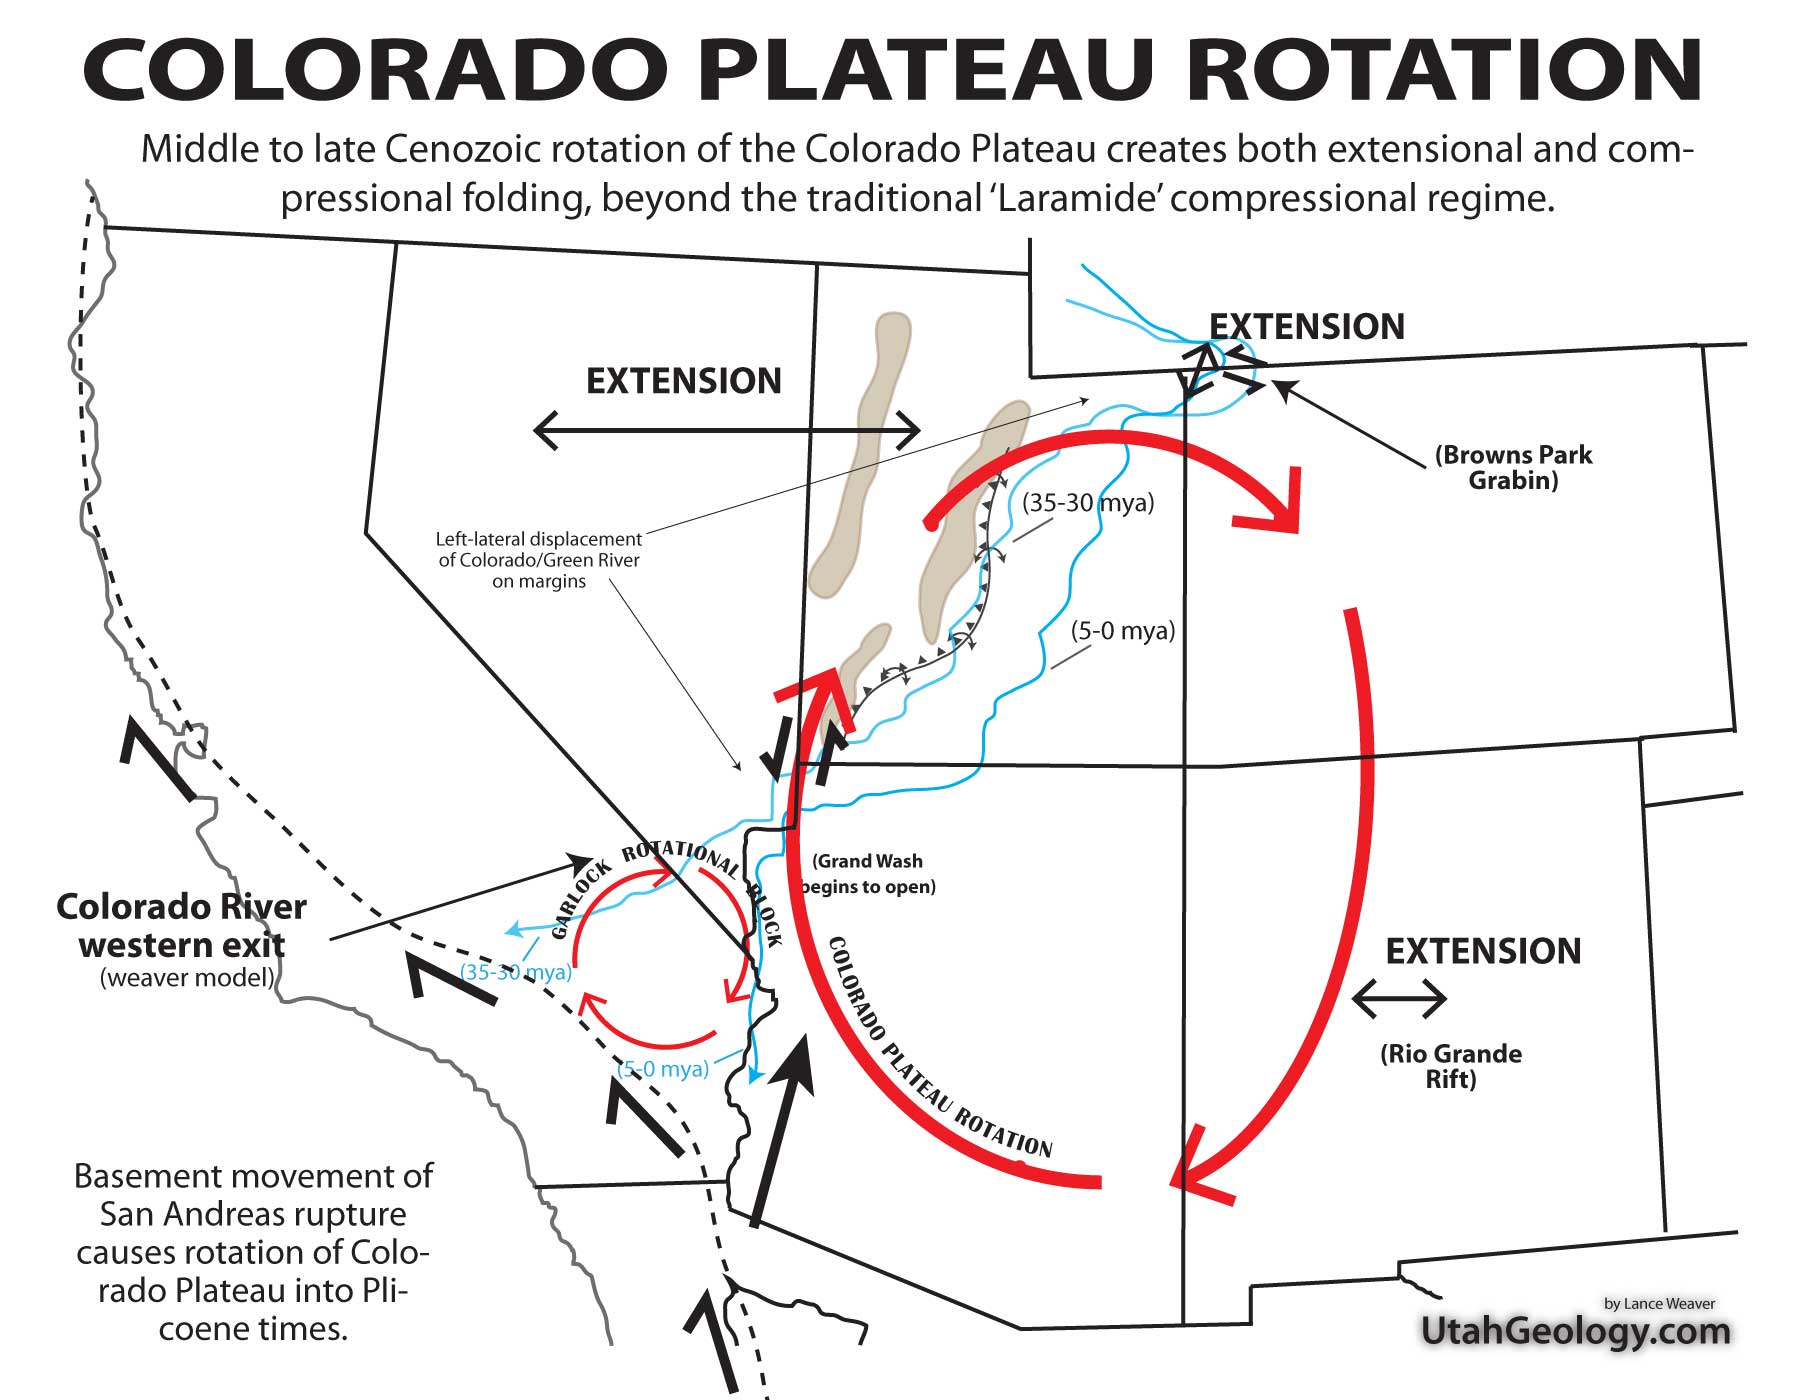
Clockwise Rotation of the Colorado Plateau
The rotation of the Colorado Plateau began as a byproduct of Laramide Orogeny crustal shortening, where the lithospheric block acted as a rigid “microplate” resisting the intense deformation surrounding it. While initial movement was subtle, the rotation accelerated significantly with the transition to a transform plate boundary and the development of the San Andreas Fault system. As the Pacific Plate began its northward migration, it exerted a dextral shear force on the basement blocks of the Mojave and Basin and Range provinces. These blocks essentially “tugged” at the southwestern periphery of the plateau. This mechanical coupling—facilitated by the Garlock Fault acting as a conjugate shear zone—transformed translational motion into a clockwise pivoting action. This rotation is uniquely characterized by contemporaneous extension, a phenomenon often overlooked by researchers who treat the plateau as entirely stable; in reality, the “dragging” of the periphery creates a tearing effect that opens extensional basins even as the core remains intact.
This rotational torque is deeply tied to the fate of the subducted Farallon Plate. As the Farallon slab foundered and “swallowed” into the mantle, the resulting slab rollback and delamination created a suction effect that allowed the lithosphere to move more freely, potentially providing the “lubrication” necessary for the plateau to rotate over the mantle. This motion has profoundly altered the structural landscape of Southern Nevada and Northern Arizona, most notably along the Grand Wash Fault. As the plateau pivots, it exerts a “shoving” force against the Basin and Range, intensifying faulting and causing the southward “migration” of drainage systems. The Colorado River, in particular, has been caught in this tectonic mill; the plateau’s rotation has effectively “dragged” the river’s lower course southward, forcing it to incise through rapidly rising basement blocks and contributing to the complex, multi-stage evolution of the Grand Canyon’s exit point at the Grand Wash Cliffs. On the opposite sides of the Colorado Plateau, this same rotation can be seen in lateral offsets of both the Rio Grande Rift and the Browns Park Graben as well.
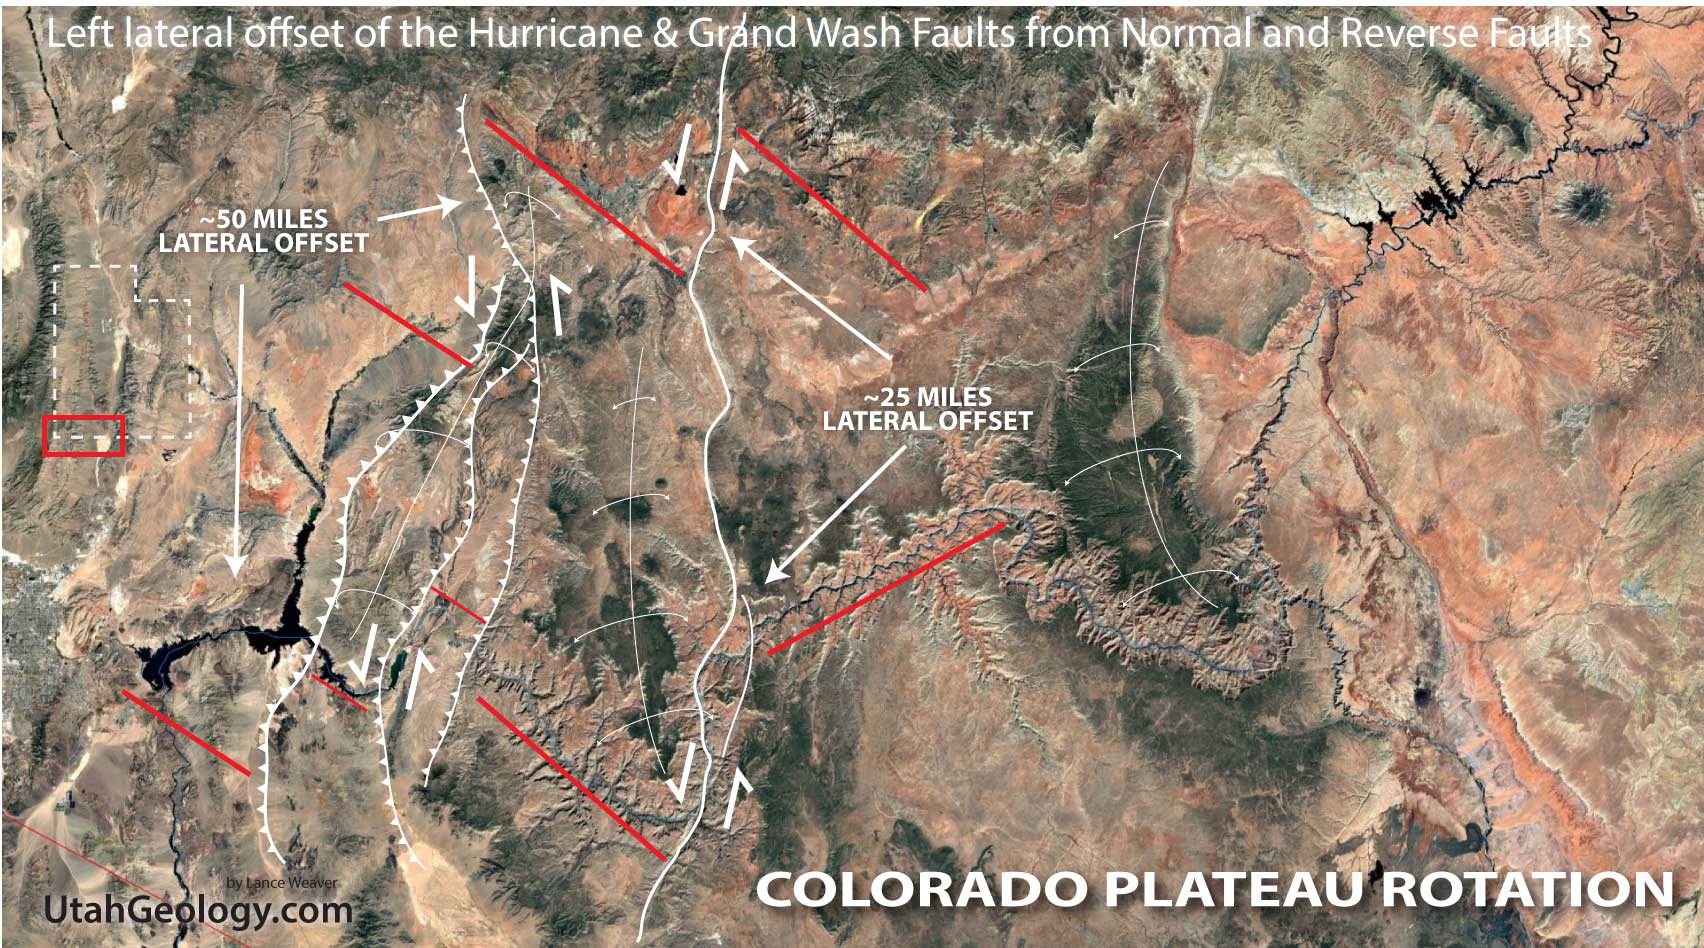
Many researchers have noted the left lateral offset on the peripheries thrust zones of the Colorado Plateau. But few see the big picture of how this offset relates to the rotation of the Plateau and how it affects the Rivers which cross it. (see Kowallis, et al, 2005; Ashby et al, 2005; Grauch et al. 2017, USGS, etc)Perhaps the most convincing evidence of the left lateral movement on normal & reverse faults bounding the Colorado Plateau is the 25 mile ‘jog’ of the Colorado River as it crosses the Hurricane Fault. Similar jogs or zigzags near the Grand Wash faults suggest the river was dragged and displaced laterally with the lateral movement on the faults. Similar offset features can be seen in the seemingly offset Navajo Sandstone cliffs of the St George basin. I suggest this lateral displacement happened both during early compression AND later extension.
.
The Gilbert Erosional Surface
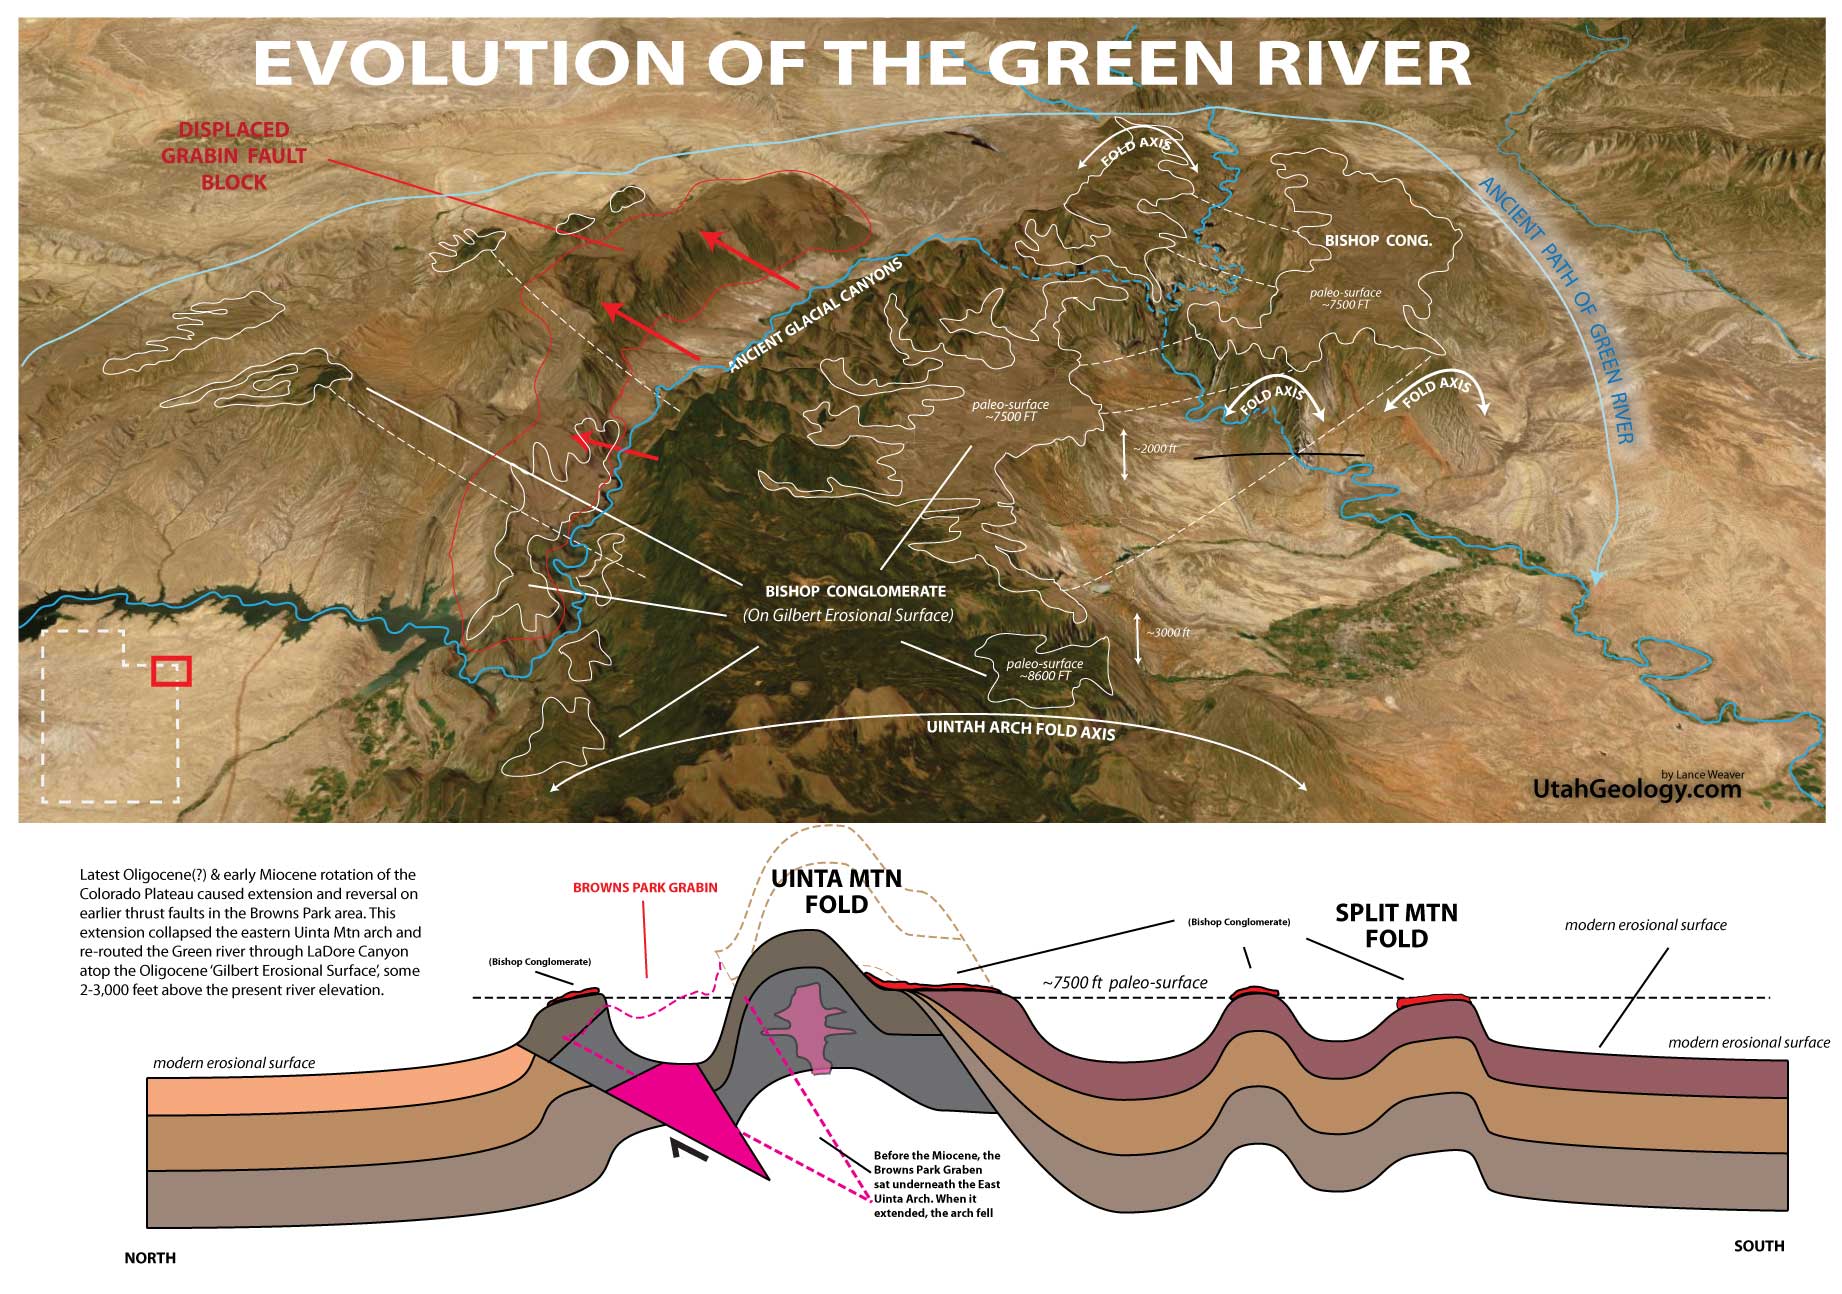
The Gilbert erosional surface and the Bishop Conglomerate that is draped over it, provide an unmistakable structural “timestamp” for the evolution of the Colorado River system. This vast, high-level pediment surface suggests that by the Oligocene (roughly 34–30 Ma), the intense tectonic activity of the Laramide Orogeny had transitioned into a period of relative topographic stability. During this window, the valley’s below the Uintah’s (and other Laramide mountains) were worn down into a broad peneplain—a nearly level, low-relief landscape where rivers flowed across a flat expanse of eroded older rocks, much like the plains of modern-day Wyoming. The fact that the Bishop Conglomerate, a coarse, high-energy gravel deposit, sits undisturbed atop this surface proves that the deep incision of the Green and Colorado rivers had not yet begun in that region. Similar ‘rim gravels’ south of the Grand Canyon suggest a similiar situation at the south end of the Colorado Plateau. At that moment, the “saw” had not yet touched the “log”; the drainage was established on a flat, elevated sheet of sediment, poised to begin its downward cut only after the subsequent collapse of the Navadaplano Mountain belt or base-level shift of the Miocene.
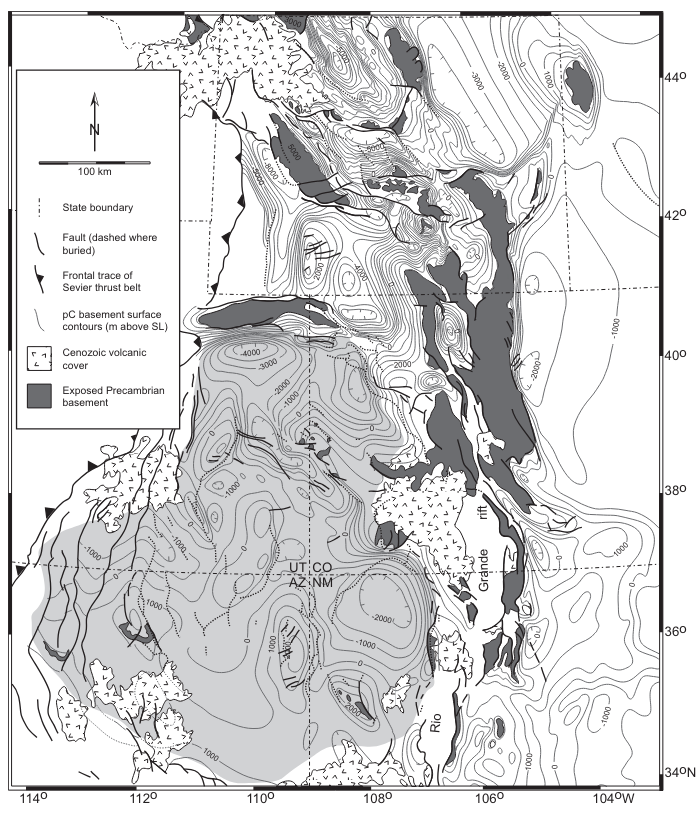
The Gilbert erosional surface (seen outlined in white) is a great ‘fossilized landscape’ helping us to visualize what much of the Colorado Plateau likely looked like during the Oligocene before the final 2-3,000 feet of post-Oligcene erosion occured.
Integration of the Green River into the Colorado River
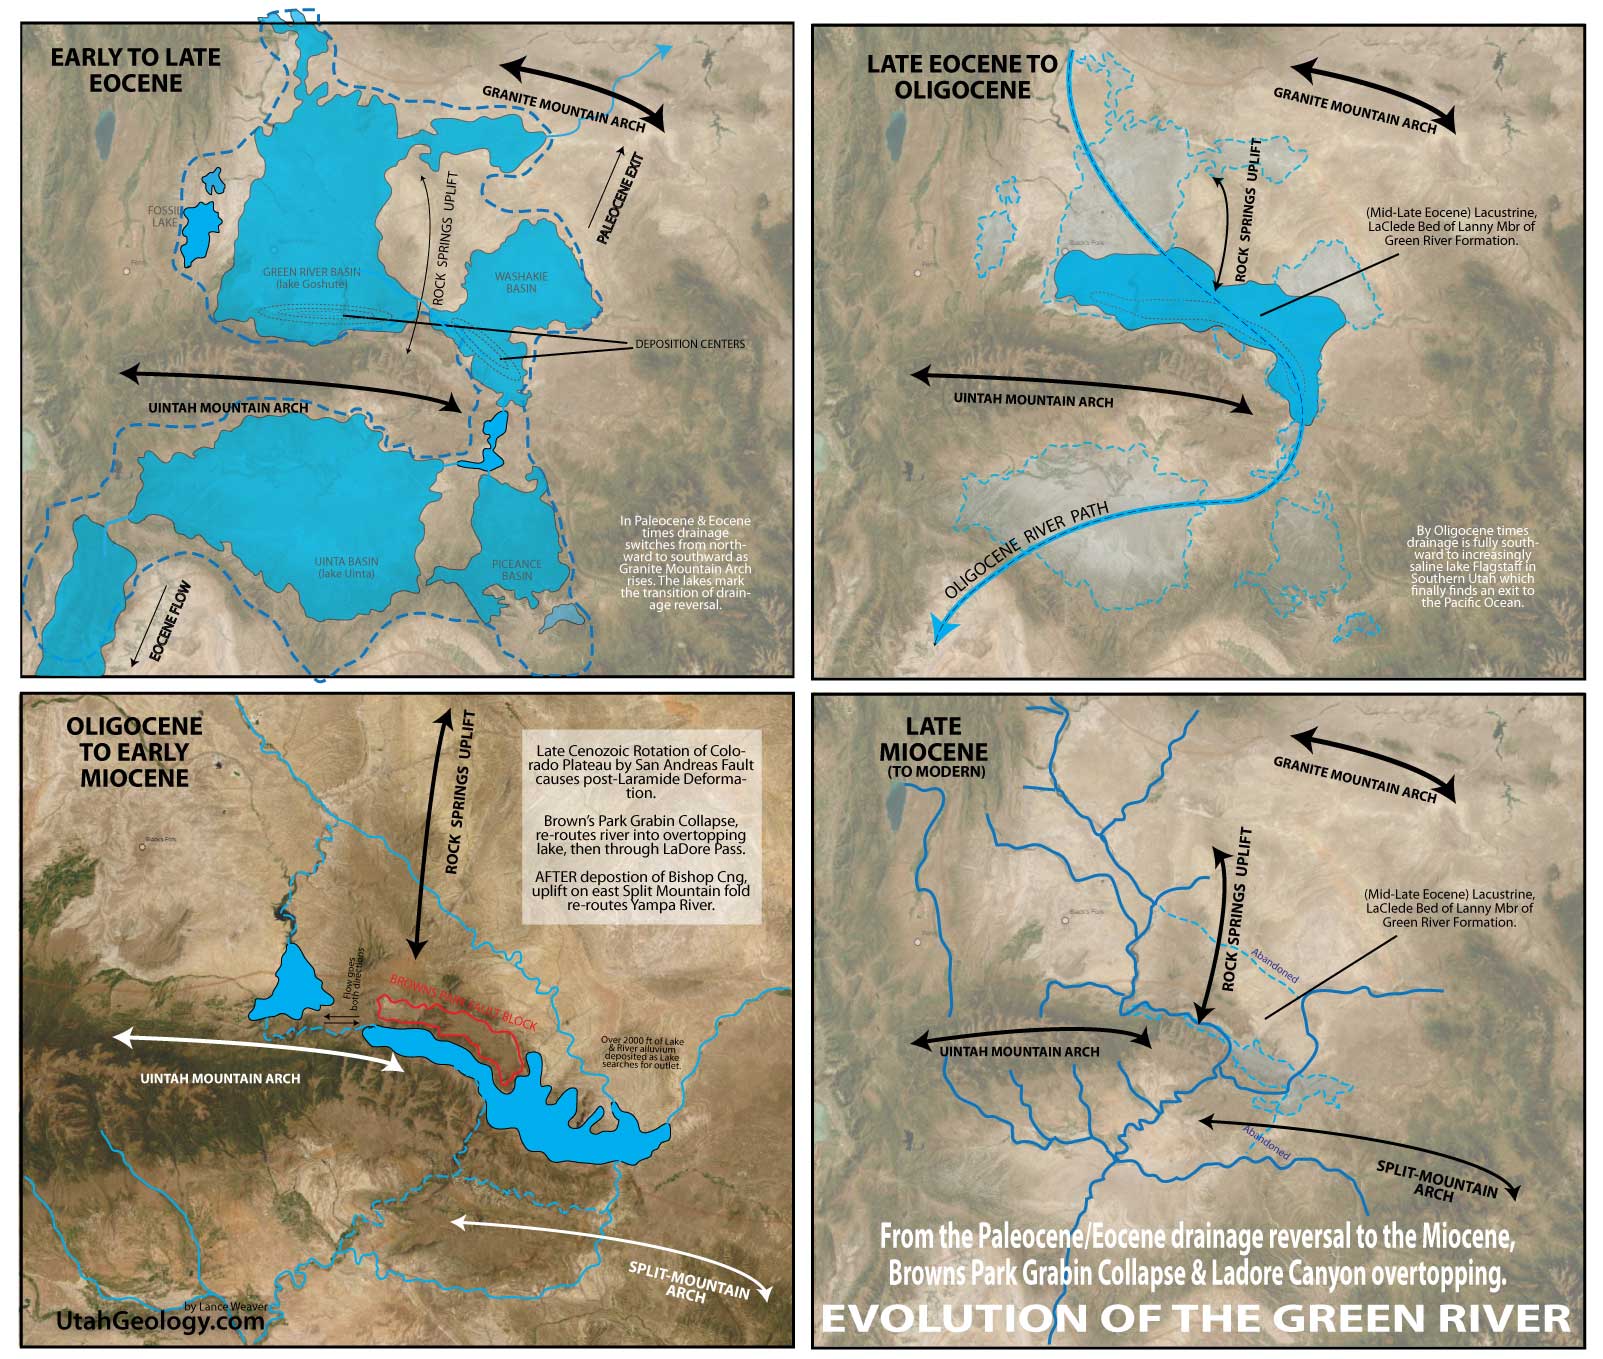
My argument in this article is that the Colorado River found its present outlet to the Pacific ocean in the latest Eocene or Oligocene as the Eocene lake systems of Utah, Colorado & Wyoming filled with sediment and allowed a ‘spillover’ of drainages through a low southwestern pass. I also argue that the 5-7 million year evidence for Colorado incision is misinterpreted. This being the point that collapse of the Navadaplano allowed deposition of Colorado River sediments and rapid down-cutting into the Colorado Plateau. NOT THE AGE OF THE RIVER! In a similar fashion I argue that the Green River found an early integration into the Colorado River during the same late Eocene & Oligocene fill-to-spill of the lake systems. And that the Browns Park Formation marks a period of Colorado Plateau rotation and graben collapse and incision, NOT the initial integration of the Green & Yampa rivers into the Colorado.
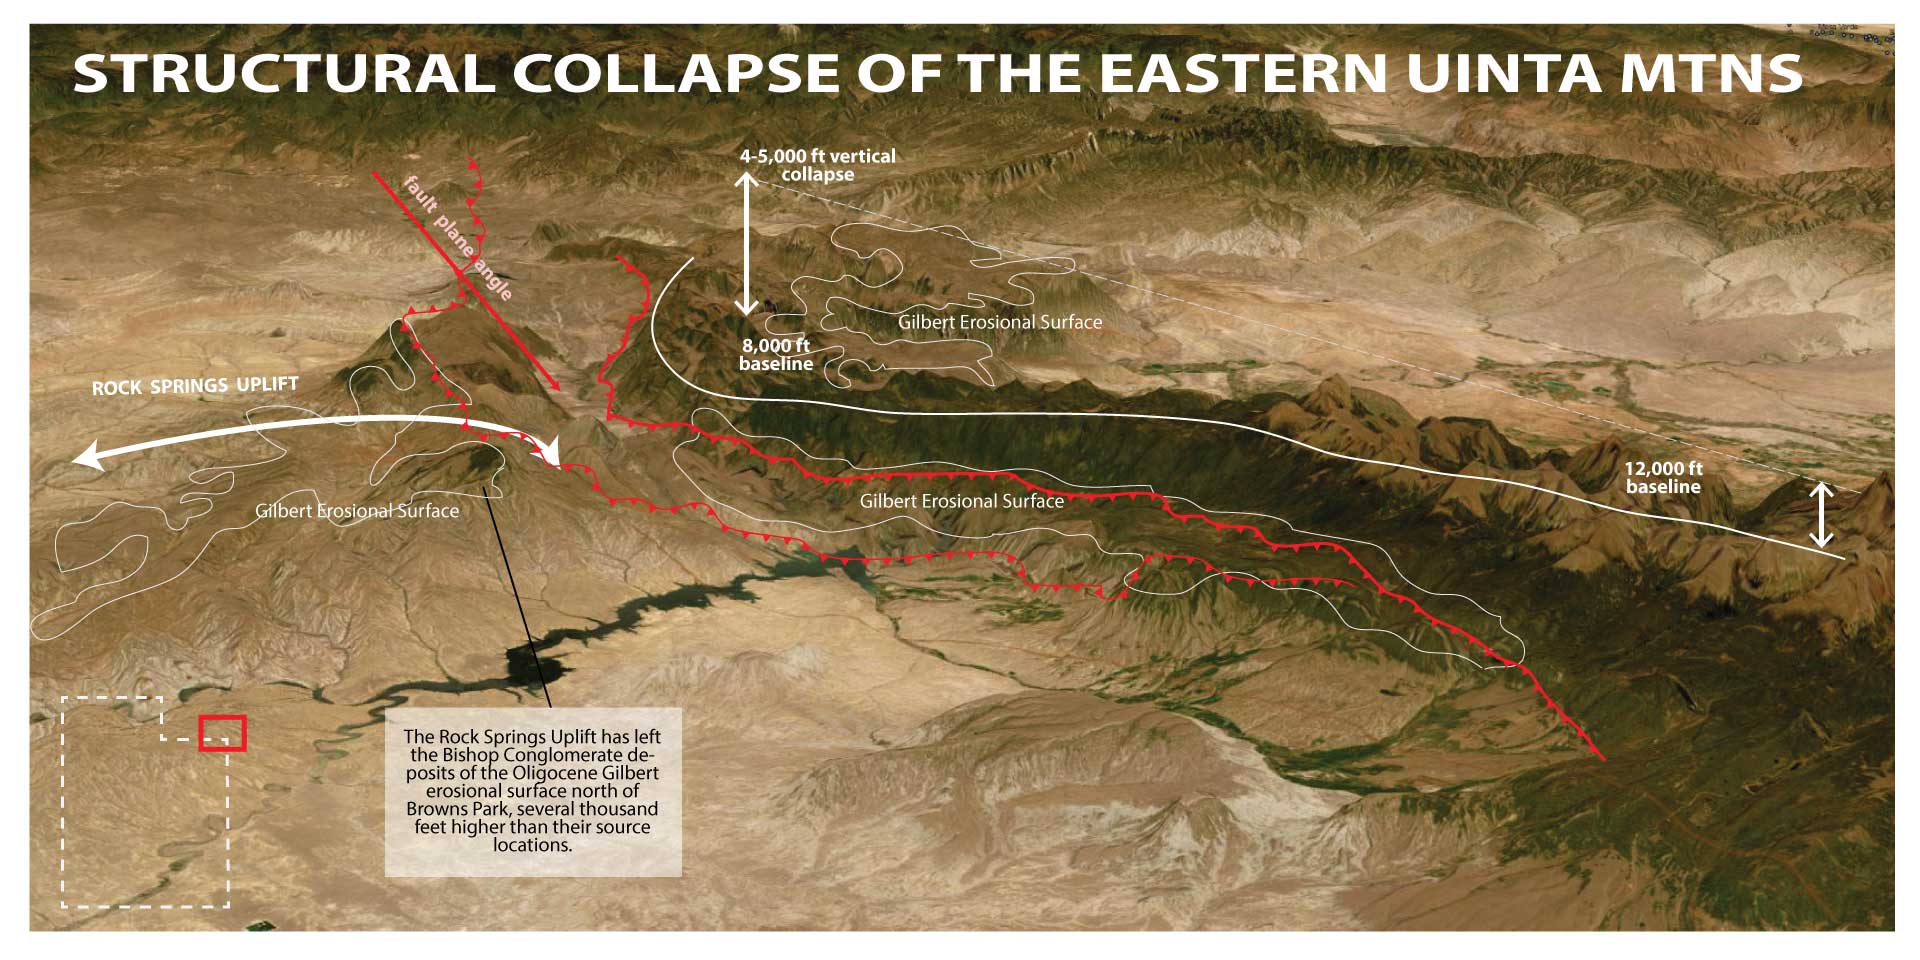
The Browns Park Formation and its associated graben do however provide the critical constraint on exactly when the Green River found its present course and began ‘sawing’ through the Uinta Arch. As the northeast limb of the Uinta Mountains were pulled apart by Miocene extension, the Browns Park graben began to drop, creating a structural trough that filled with volcanic ash and fluvial sediments. The crucial detail lies in the fact that the Green River currently flows across this graben and then dives directly into the heart of the Uinta uplift at Lodore Canyon. This relationship suggests that the river was “captured” or established within the soft fill of the Browns Park graben during the Miocene. Once the river overtopped its basin (one of the Colorado Plateau’s few “fill-to-spill” events), it was superimposed onto the harder, underlying Precambrian rocks of the Uintas. The timing of the Browns Park deposition (roughly 25 to 10 Ma) effectively pinpoints the transition from the flat Oligocene peneplain to the aggressive, canyon-cutting drainage system we see today.
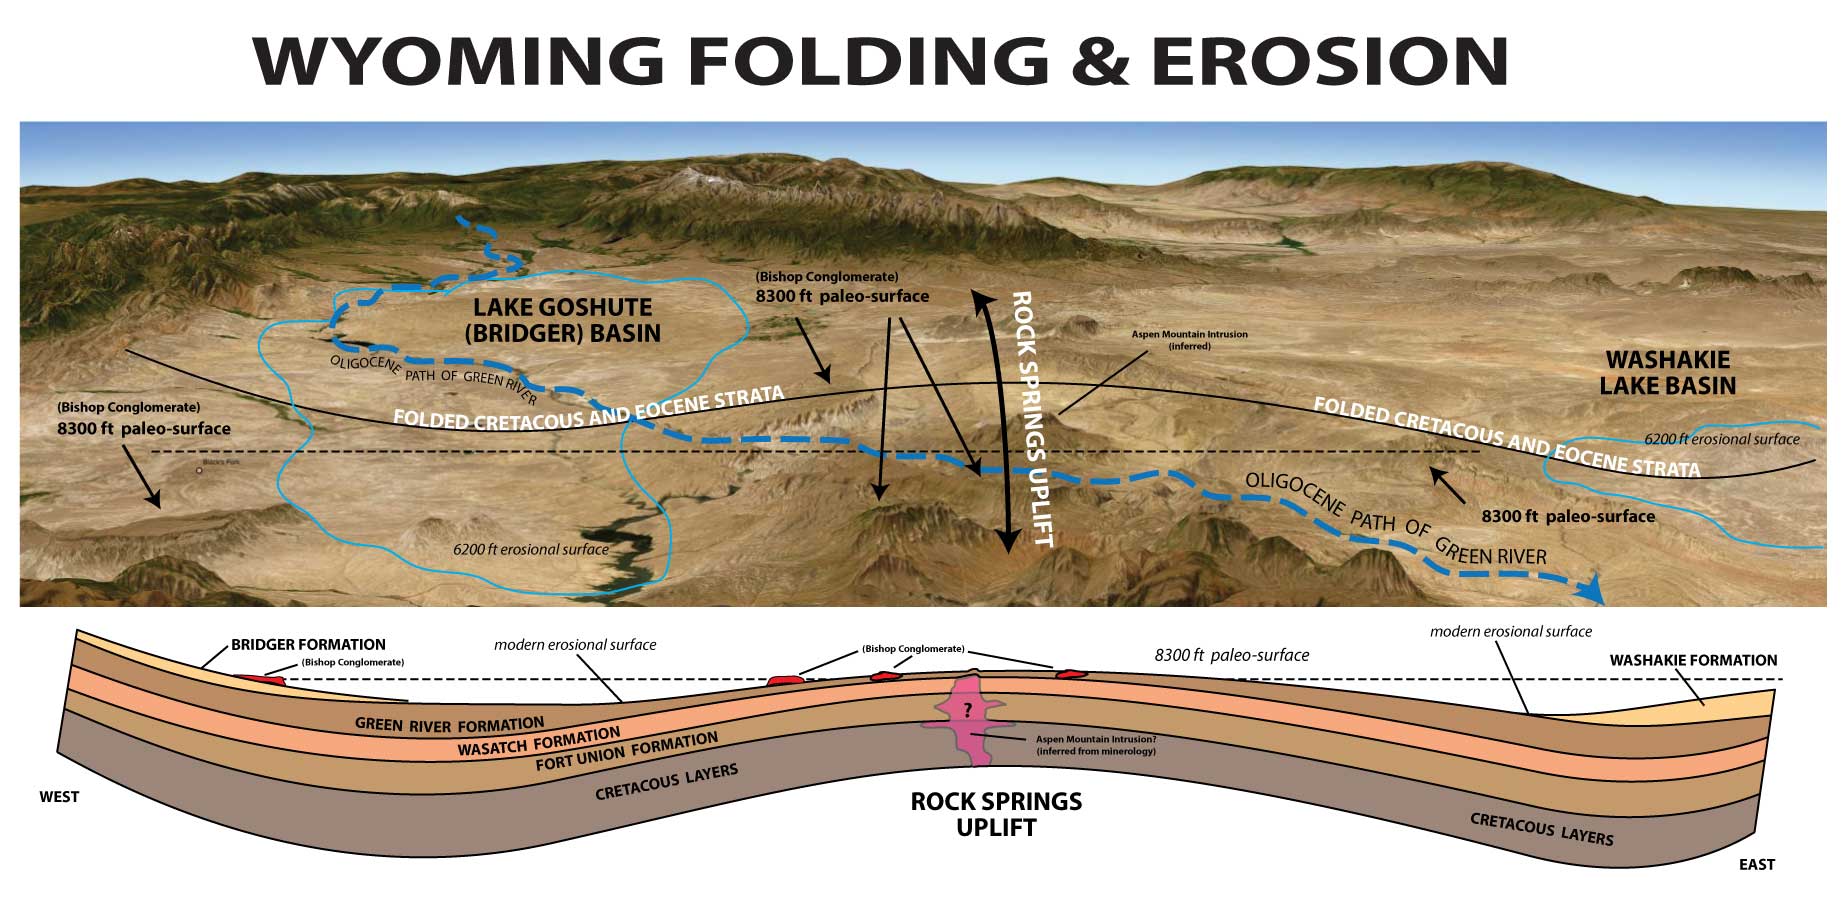
Image showing the elevation differential in the structural collapse of the eastern Uinta Mountains. Note the eastern limb now sits some 4-5,000 feet lower than the central Uinta’s. As seen in the previous illustration, this was caused by reverse (normal) movement on the northern thrust zone, sliding back out (northward) form beneath the fold, subsequently creating the Browns park graben. Evolution of the Green River from the Paleocene to modern. Debate exists on the path of the Oligocene drainages, but all agree on a Miocene integration into Lodore Canyon and the modern course of the river. Sprinkle, Cather & Dickinson (2011) favor an Eastern Platte exit based on detrital Zircon evidence. I side with Johnson et al (2011) for an Eocene integration, knowing that had the basin ever drained eastward through ‘Fillmore Gap’ it would have created a massive lake system when such a pass rose to block it off. Much like the Southern Colorado Plateau, detrital Zircon evidence is a HORRIBLE indicator of basin reconfigurations as there are so many assumptions built into the interpretations.View looking from Uintas, northward toward the Windriver Mountains. Lake in foreground is Flaming Gorge NRA. Note the Rock Springs Uplift in the center (running north south) has uplifted the Bishop Conglomerate of Miller Mountain considerably higher than its original position (its now higher than the collapsed Uinta’s themselves). The Rock Springs arch would have also cut off the paleo-channel of the Green river which would have had to flow NORTH of the Miller Mtn in the foreground but south of Aspen Mountain which appears to be a late Miocene uplift, likely caused by a still buried igneous intrusion as inferred from the mineralogy of silicified zone with iron oxides, alunitic and kaolinitic alteration from hot springs.
Grand Canyon ‘Rim Gravels‘ as a Signal of Incision
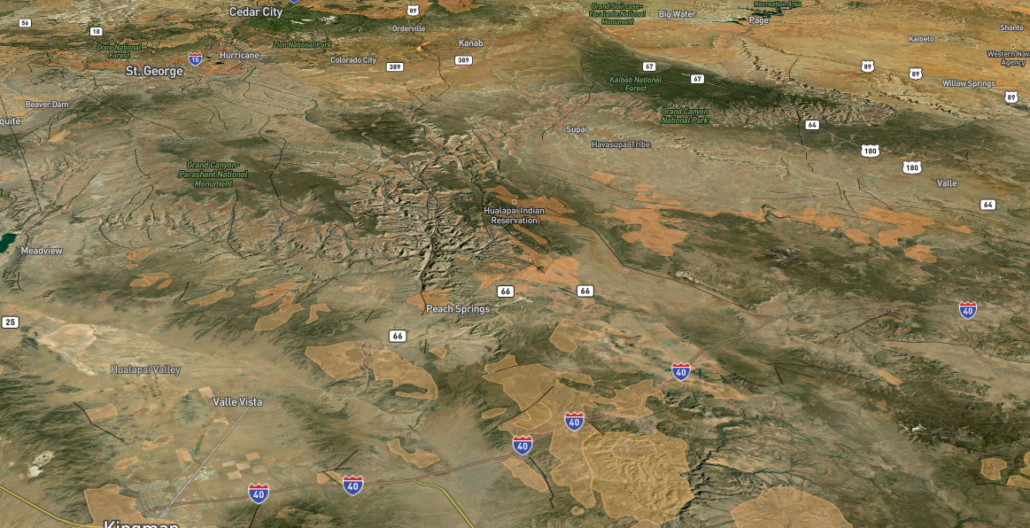
The Oligocene “Rim Gravels” of Peach Springs and the Hualapai Plateau are great evidence for when the foreland basin of the raising central Utah thrust belt finally pushed the structural low to the present location of the Colorado River . Why don’t they exist until the Oligocene? Because from the Cretaceous to the Paleocene, rivers flowed unimpeded Northward into the Cretaceous seaway and later into the great Eocene lake systems and later into the rapidly approaching Colorado River system. In the Paleocene through Eocene the Claron & Green River basins became closed and waters and sediments were trapped in the closed lakes of.., these lakes began to rapidly rise, and it was the Oligocene when sediment filled the basin to the point of overflow finding an exit through a low pass in the Navadaplano mountains. After overflow, the river began to rapidly migrate toward the area of the Grand Canyon region, which acted as the structural low or hinge-point likely in the late Oligocene. That is why gravels started accumulating there and why it became the stopping point of the southward migrating river system. [rewrite]
The fact that ‘Rim Gravels’ ONLY exist south of the river is evidence that the river has swept south over time.
The Oligocene ‘Rim Gravels’ of Peach Springs and the Hualapai Plateau are another GREAT evidence of my theory. Why dont they exist UNTIL the Oligocene? Because from the Cretaceous to Oligocene rivers flowed unimpeded on high gradiants into the Utah oceans and lakes, but in the end Eocene these lakes began to rapidly raise, and it was the Oligocene when their rise reached the Grand Canyon region which was the hingepoint. Thats why it started accumulating gravels and why it became the stopping point of the southward migrating river!
.
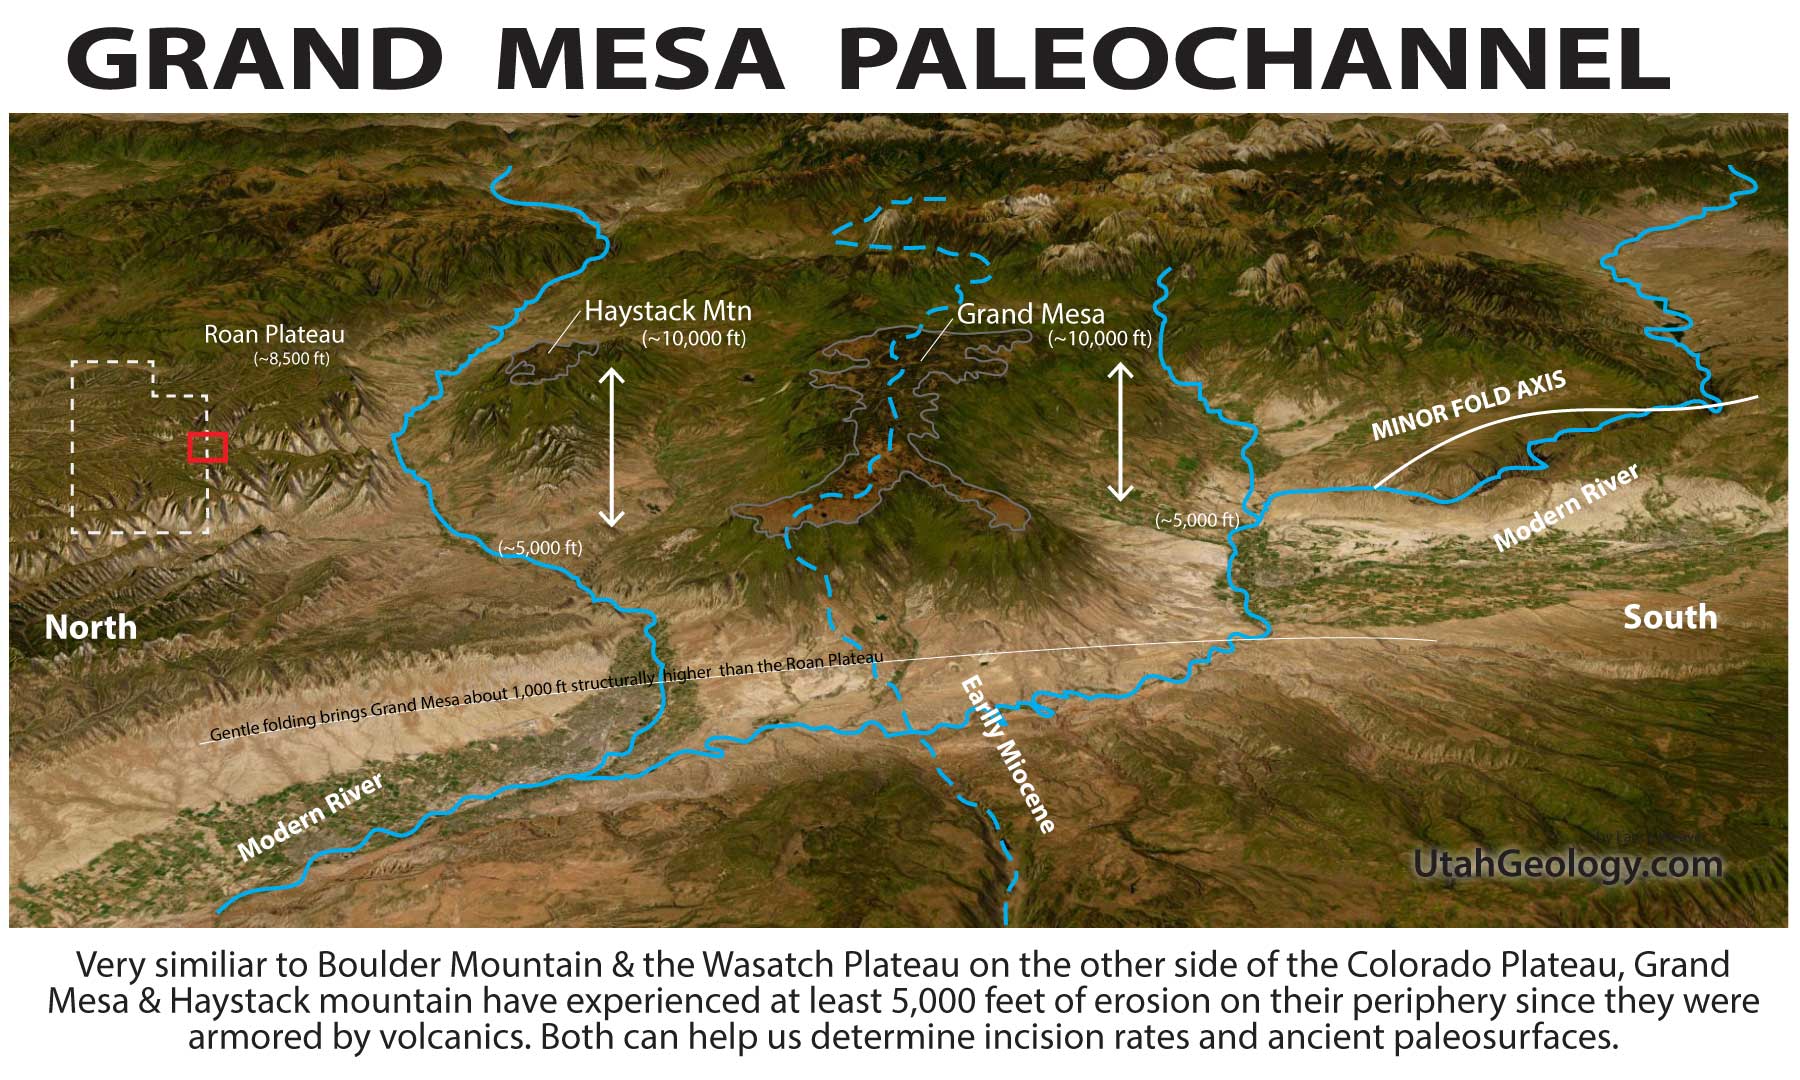
Grand Mesa as a Proxy for Rapid Incision
Grand Mesa in Westernmost Colorado is another great indicator for the geologic period when rapid incision on the Colorado River and Plateau began. It and its neighbor, Haystack Mountain, represent one of the most striking examples of “inverted topography” in the American West. Approximately 10 million years ago (Late Miocene), basaltic lavas erupted from vents to the east and flowed into a broad, low-relief paleovalley. This ancestral valley floor was carved into the Eocene-aged Green River and Wasatch Formations. At the time of the eruption, the landscape was remarkably stable; the unconformity between the Eocene sediments and the Miocene basalts suggests that very little of the original rock section—likely less than a few hundred feet—had been stripped away prior to the volcanic activity. These hard basaltic flows essentially “armored” the valley floor, preserving a snapshot of the regional elevation before the onset of the Great Denudation.
Since the emplacement of these basalts 10 million years ago, the regional drainage systems have undergone a period of rapid and aggressive incision. Today, the Colorado River to the north and the Gunnison River to the south have carved deep canyons, leaving the basalt-capped Grand Mesa standing approximately 5,000 to 6,000 feet above the modern valley floors. This implies an average incision rate of roughly 150 to 180 meters per million years. This dramatic downcutting provides critical evidence for the relative youth of the modern Colorado River system; it suggests that the massive erosional power required to carve both the Grand Mesa region and the Grand Canyon downstream was likely triggered by the river’s integration with the Gulf of California around 6 million years ago, leading to a wave of headward erosion that rapidly dismantled the surrounding Eocene landscape while the armored mesa remained as a high-altitude sentinel.
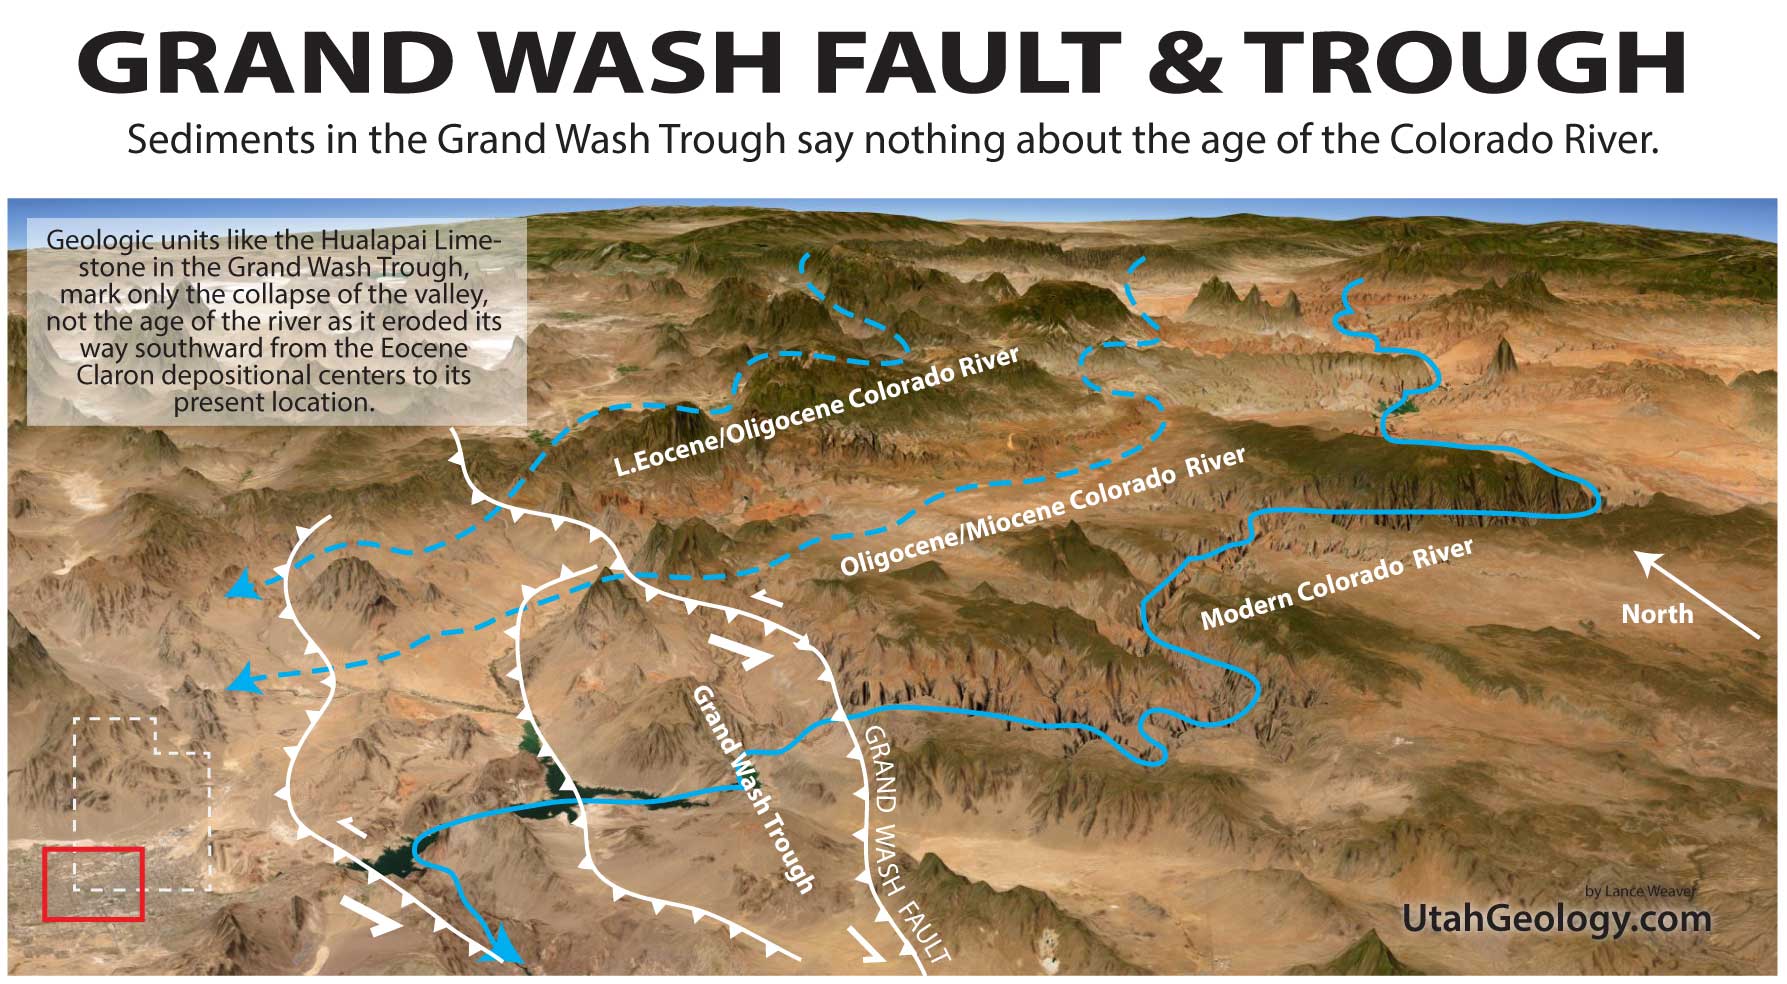
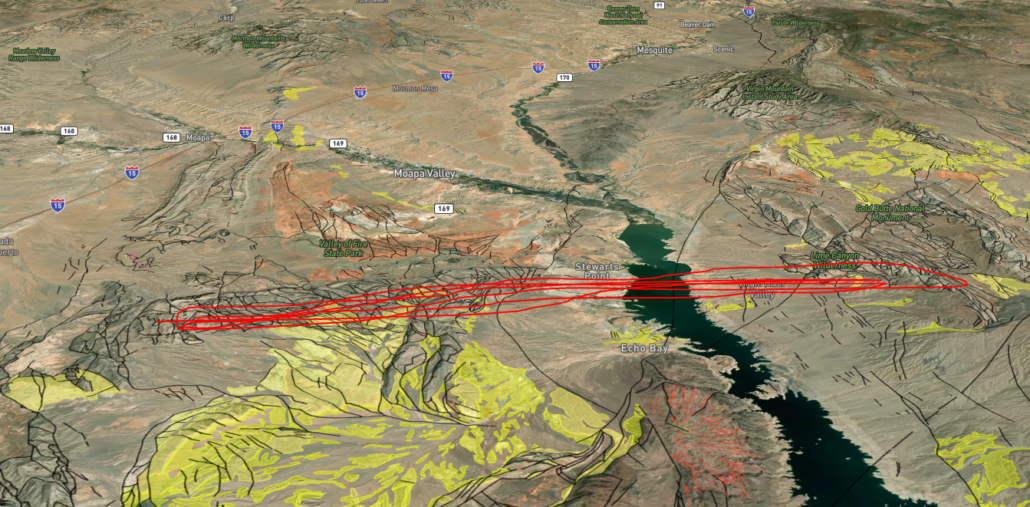
Deposits of the Grand Wash Trough & Mesquite Valley
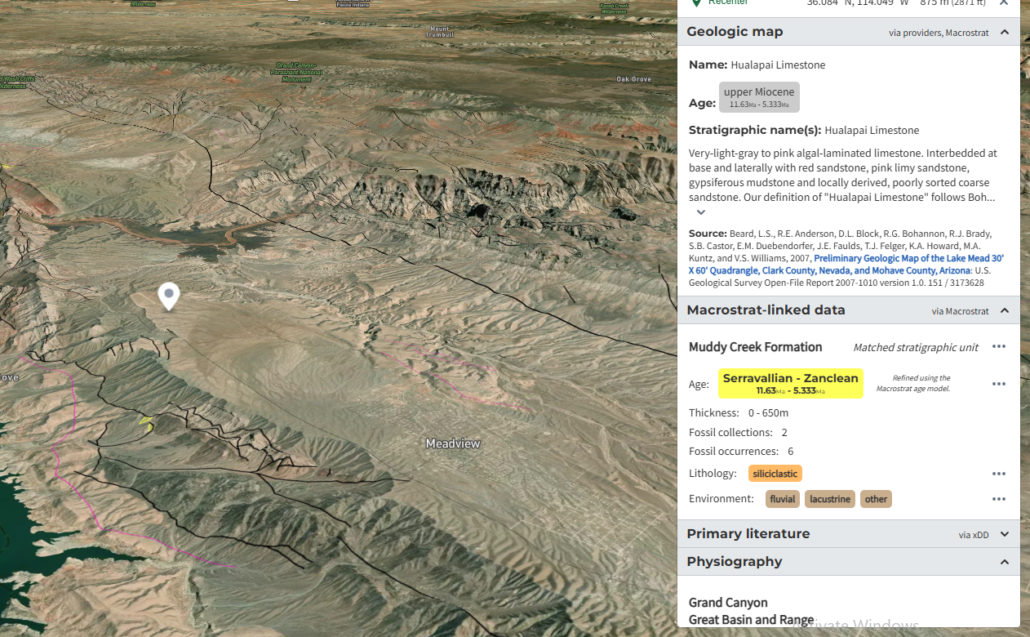
Finally, we must address the Hualapai Limestone, which fills the easternmost and highest basin of the Grand Wash Trough as the uppermost member of the Muddy Creek Formation. Some researchers, like Pearce (2010), suggest that because these layers lack “Colorado River signatures,” the river couldn’t have been there any earlier than detrital zircons might suggest. I think many greatly misinterpret detrital evidence. The location of the Oligocene river gravels and the Henry Mountains laccoliths upstream suggest the Colorado was pushed into a trough near its present location quite quickly after the end of drainage reversal manifested by the Eocene lakes. But ANY DEPSITS in the Grand Wash trough or Misquite basin do not necessarily tell us when the Colorado River started flowing through the region. They instead only tell us when those basins collapsed to a point where they began receiving depositional sediments. I suggest that the Colorado flowed through its upper gorge to a region south of the present Grand Wash Trough (transported south by rotational forces), likely without leaving much evidence until 5 Ma, when it was temporarily blocked from its west exit and redirected south by a pulse of collapse/shear forces. The layers in that trough are much like the flood deposits of Grand Junction to the north; most of the sediment comes from adjoining Cretaceous hills, but the river backed up occasionally during huge outflow floods from the Rockies. Pearce even mentions that the water chemistry is similar to spring-fed Havasu Creek (high in carbonate). I suggest this is not evidence of a local spring, but rather evidence of an ice-dam break, which caused a short-lived backup, allowing the limestone to form from the carbonate-rich waters of the high plateau.
annotate this…
Also NOTE how the Hualapai Limestone fills the easternmost and highest basin of the Grand Wash Trough. It is the uppermost member of the Muddy Creek Formation.
Be sure to answer the Pearce 2010 paper that suggests that the Grand Wash Trough’s Hualapai Limestone (Miocene) and its layers beneath did NOT have Colorado River signatures. My argument is that the Colorado flowed through without leaving much evidence until 5mya when it was BLOCKED from its west exit and was redirected south. The layers in that trough were MUCH like the flood deposits of Grand Junction to the north, most the sediment in those layers come from the adjoining Cretaceous hills, but the river does back up occasionally during huge outflow floods from the Rockies. IN FACT she mentions that the water chemistry is like spring fed Havasu creek (high in carbonate), I suggest this is evidence of an ice dam break, which caused a short lived backup and limestone formation.
Write a bit on how you shouldn’t be looking in the grand wash trough for early colorado river sediments….
The Muddy Creek layers in the Mesquite Basin say nothing of the age of the Colorado, but instead they infer the date when the upper virgin basin was separated from the Colorado by the traverse fold highlighted in red in the figure above.
.
THE SALTON TROUGH AS AN ANALOG
A great modern analog of Lake Hualapai and Muddy Creek Lakes depression is the Salton Trough. It also has thick limestone deposits that border on Tufa. I’ll bet it has a similar geochemistry. Deposits on the alluvial fans downstream of Borrego Springs are locally derived and the natural levees of the Colorado River keep it separate from the Trough most the time with small exceptions.
Image of Lake Cahuilla Shoreline, just above Coolidge Springs north-west of the Modern Salton Sea. Ancient shoreline of the short-lived Lake are readily visible. (Image from google earth from user Robert Hyatt. Likely open source-ish)
IMAGINE USING SIMILAR GEOLOGIC UNITS IN THE SALTON TROUGH TO SUGGEST THE COLORADO DIDN’T EXIT TO THE SEA DURING THE LAST ICE AGE?!
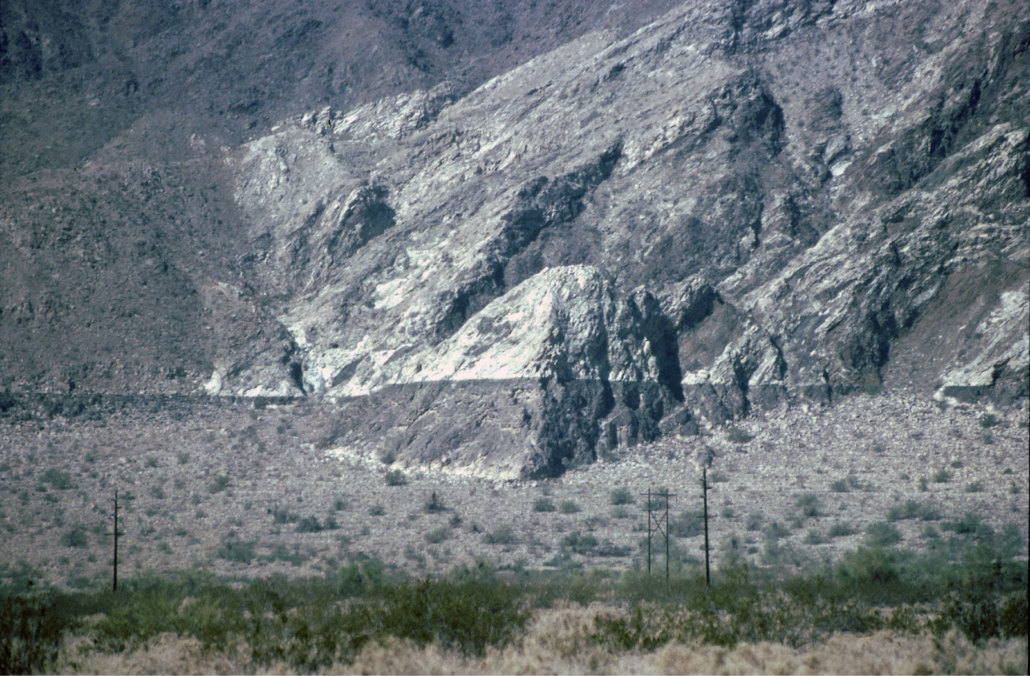
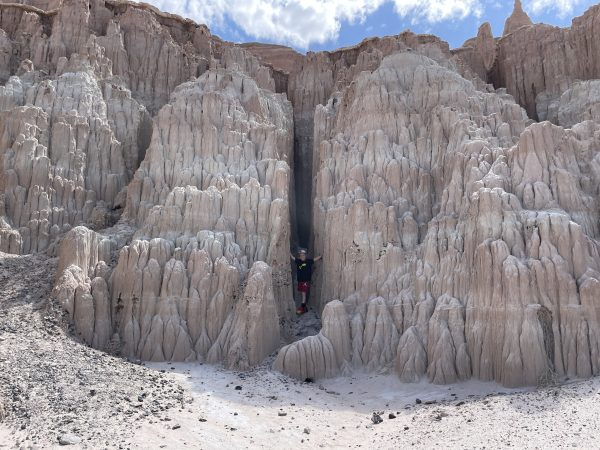
CATHEDRAL VALLEY AS AN ANALOG TO HUALAPAI FM
(Image of lacustrine sediments of Cathedral Valley Nevada. replace with my pics)
The thick basel limestone units are a good example of how a trapped lake can form right next to an existing river course.
.
Be sure to answer the Pearce 2010 paper that suggests that the Grand Wash Trough’s Hualapai Limestone (Miocene) and its layers beneath did NOT have Colorado River signatures. My argument is that the Colorado flowed through without leaving much evidence until 5mya when it was BLOCKED from its west exit and was redirected south. The layers in that trough were MUCH like the flood deposits of Grand Junction to the north, most the sediment in those layers come from the adjoining Cretaceous hills, but the river does back up occasionally during huge outflow floods from the Rockies. IN FACT she mentions that the water chemistry is like spring fed Havasu creek (high in carbonate), I suggest this is evidence of an ice dam break, which caused a short lived backup and limestone formation.
The Grand Mesa basalts date to around 10mya and sit about 5,000 feet east above Grand Junction and give some indication of the timing and amount of erosion of the upper Colorado River. They are often used to suggest the 5 Ma age of Colorado River creation. But these can’t be considered without also considering the Miocene Eagle River Collapse Center basalts just upstream (Hinsdale Formation & Servilleta Formations?). These basalts sit on the Weber Sandstone on a surface that feels like eastern Split Mountain. And they date to EARLIER than those of Grand Mesa (as early as 30-20 Ma), and yet they are on a more eroded surface suggesting….
This GSA paper by Lidke et al 2002 details the entire Miocene/Oligocene history of the upper colorado, and there was definitely considerable erosion on the surfaces these 30-20 Ma basalts are deposited on!
The detridal Zircon evidence see page 83, Pearce 2010, ONLY speaks to where most the sediment in those beds was coming from.
Fall of the Nevadaplano (15-0 MYA) -The beginning of Basin & Range extension is well researched from abundant evidence. (write a summary of it here)
I think the only common misunderstanding I see and read about regarding it, is the fact that nearly EVERY extensional fault and mountain range in the region is a reactivated Mesozoic & early cenozoic feature. And many of the normal faults likely began during compression. I think many geologists forget or dont learn that although compressional faults are rare under extensional forces, extensional (normal) faults are incredibly common during compressional forces.\
In other words, many normal faults that are often supposed to be associated with Basin & Range extension were actually formed during early compression. Likewise, many basin deposits which are believed to be associated with Basin & Range extension were actually deposited in subsiding basins during compression. [AND HONESTLY THIS IS HUGE… WE NEED MORE GEOLOGIST FINDING THESE DEPOSITS BECAUSE THEY WILL FILL IN HUGE GAPS OF OUR UNDERSTANDING.]
The Grand Castle and Canan Peak Formations are late Cretaceious in age, perhaps as early as 100mya suggesting orogenic uplift made its way to central utah around this time
Colorado River Formation References (Papers to Cite)
-Great overview of Green River capture: Revisiting the Classic Conundrum of the Green River’s Integration through the Uinta Uplift. Joel Pederson (use its refs, its in my peleo drive folder) -Pre-Colorado River Paleogeography and ext along the… James Faulds, Price & Wallace (my folder) -search through all of these: file:///H:/My%20Drive/%60UtahGeology.com%20Website%20Stuff/paleogeography%20reconstructions/paleogeography%20papers/Tons_Of_Colorado_Platuea_Evolution_Papers.htm
-DRAW SOME ILLUSTRATIONS WITH ALL THESE EVIDENCES ON THE MAP!!
-ALSO DRAW A MAP OF CLARON FM area of the Grand Staircase showing that as soon as the four basins (pinevalley, markugunt, paunsagunt & Aquarius Plateaus) finish filling, they are uplifted and SEPARATED at 33 mya which causes EACH to find an outlet to the south through the paleo-virgin, Kanab creek, Paria and Escalante drainages.
-REMEMBER: knowing from the Bishop Cng and Wasatch Plateau that the folds really took off AFTER 33 mya, is important, because then we can also assume that the Paria/Cockscomb, Kaibab uplift and Virgin River Gorge uplift really take off then too. AND WE KNOW EACH OF THEM MUST HAVE REVERSED BY 33 MYA! -And the reversal of the Paria drainage has major implication to the formation of the Grand Canyon, It must have been flowing the current direction by not much after 33 mya, and had to have been flowing INTO the claron basins,
-WHEN DOES THE VIRGIN RIVER REVERSE? During the Claron of course! Between 55-33 mya, and all the others are likely the same!
WHEN DO THE COLORADO PLATEAU UPLIFTS OCCUR? -I think they must be later/more recent than I first thought. It makes sense that they match with the emplacement of the intrusions, AND they have to be late if the colorado river migrated from the early cenozoic lakes, because it had to move across the san rafael swell, circle cliffs AND kaibab, so they must post date 33-25ish mya. Check out this article and quote which backs this up:
“the rise of the Kaibab and Circle Cliffs uplifts. Stockli et al. (2002) hoped to apply the (then) new technique of (U-Th)/He thermochronology to the problem of dating structural deformation of many of the Colorado Plateau uplifts. To that end, they collected and analyzed samples from stratigraphic profiles on the Circle Cliffs, San Rafael, Monument, and Kaibab uplifts. Unfortunately, all of the samples yielded ages from 33 to 11 Ma, consistent with uplift and denudation of the Colorado Plateau, but too young to be referencing the rise of individual Laramide uplifts” https://www.geo.arizona.edu/sites/www.geo.arizona.edu/files/Colorado%20Plateau%20Structure.pdf
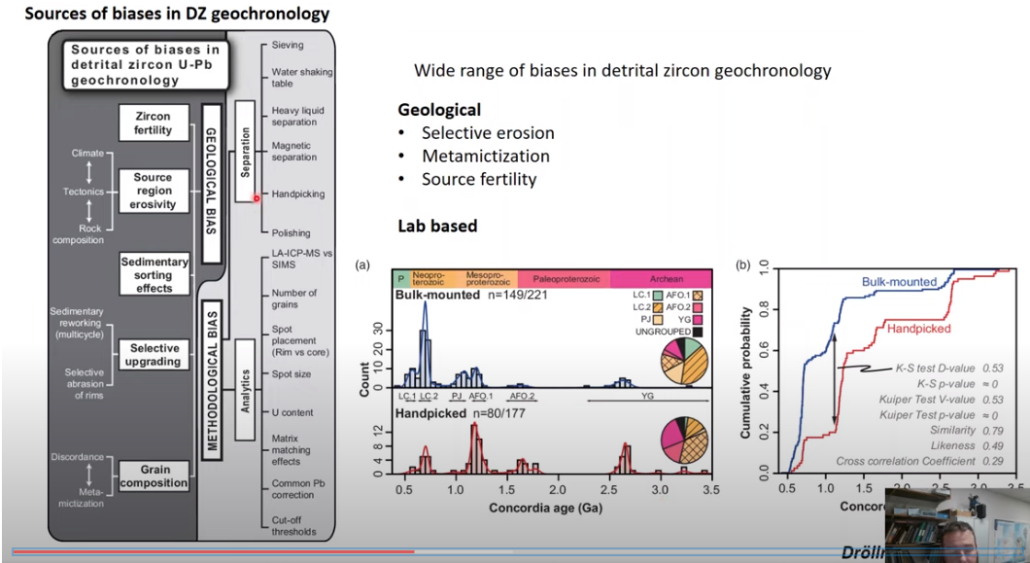
Stop using detrital Zircons!!!
They may work great in a wide variety of cases such as the dating of the Bishop conglomerate and Browns park fms, or Peach Springs conglomerates, but they just don’t work for finding the Colorado because ITS LIKE A FINDING A NEEDLE IN A HAYSTACK trying to find the early signatures for the colorado river in all those extensional basins, and what are you going to match it with? There are no good matches of areas upstream (other than the bishop cng?)
Make into a gif showing transition from chinle triassic rivers to cret to colorado.
https://utahgeology.com/wp-content/uploads/2026/02/paleogeography-reconstruction-of-Colorado-River-transition-1.jpg8501525Lance Weaverhttps://utahgeology.com/wp-content/uploads/2025/07/utah-geology-site-logo-420px-new.pngLance Weaver2025-02-21 22:12:002026-02-25 23:25:08When Was The Colorado River Formed?
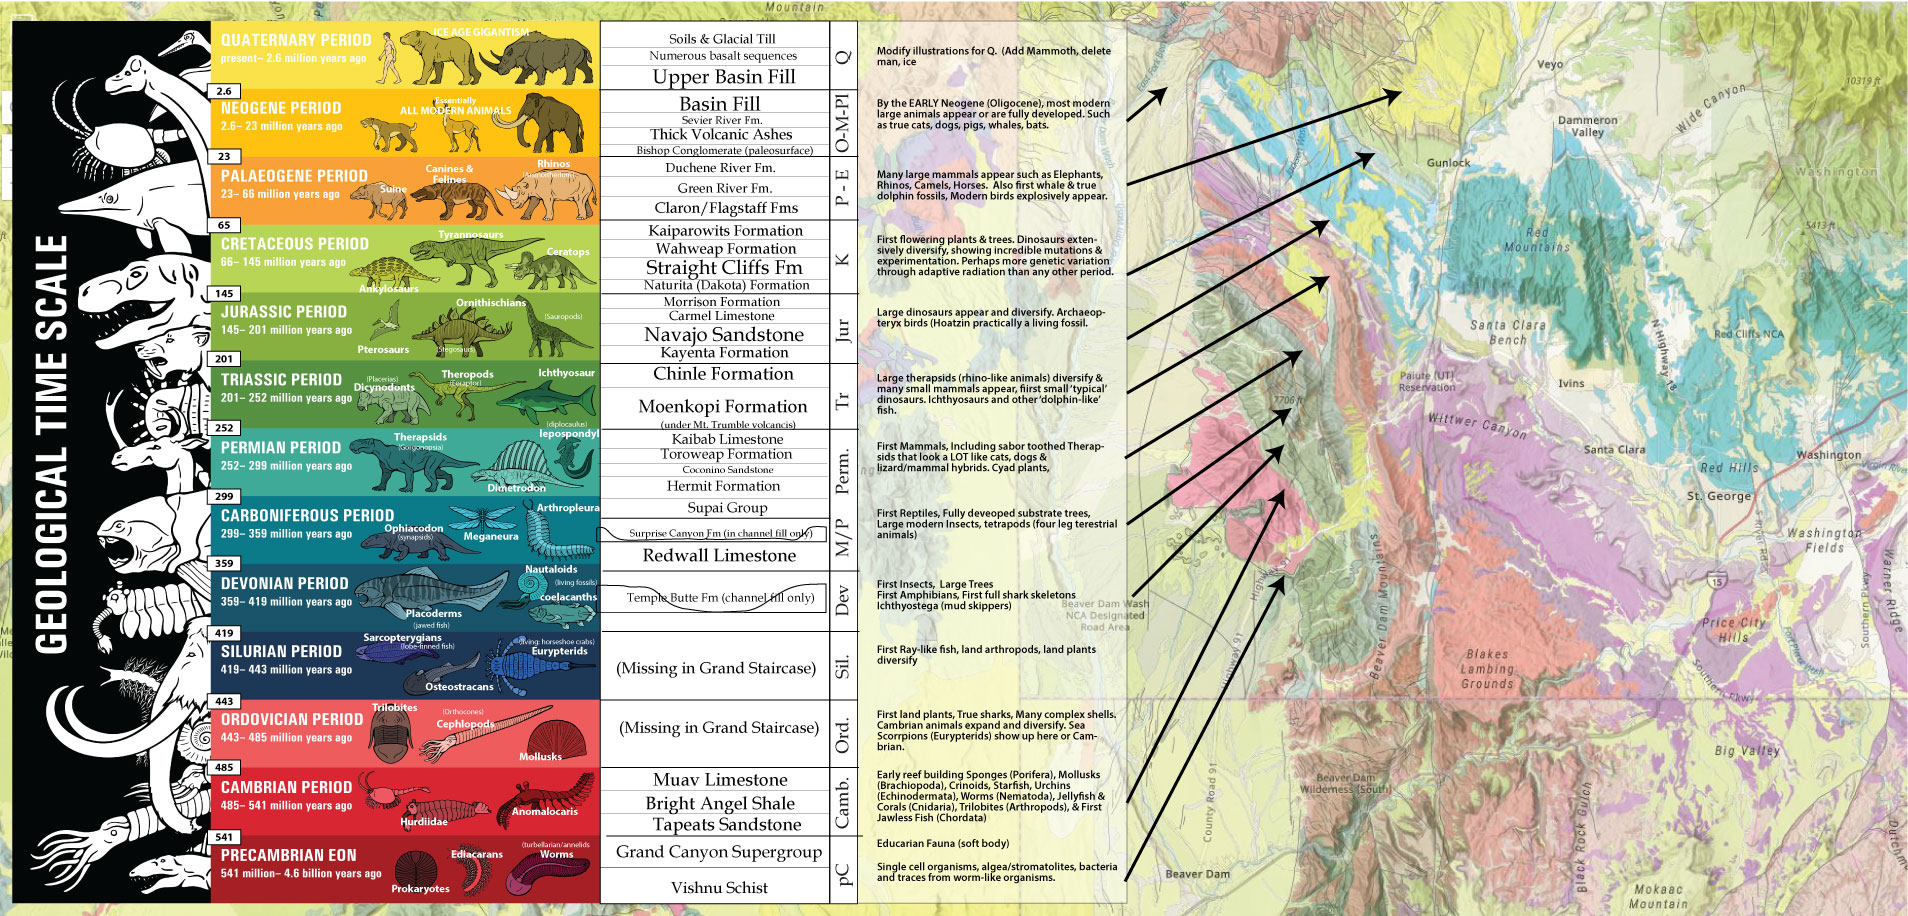
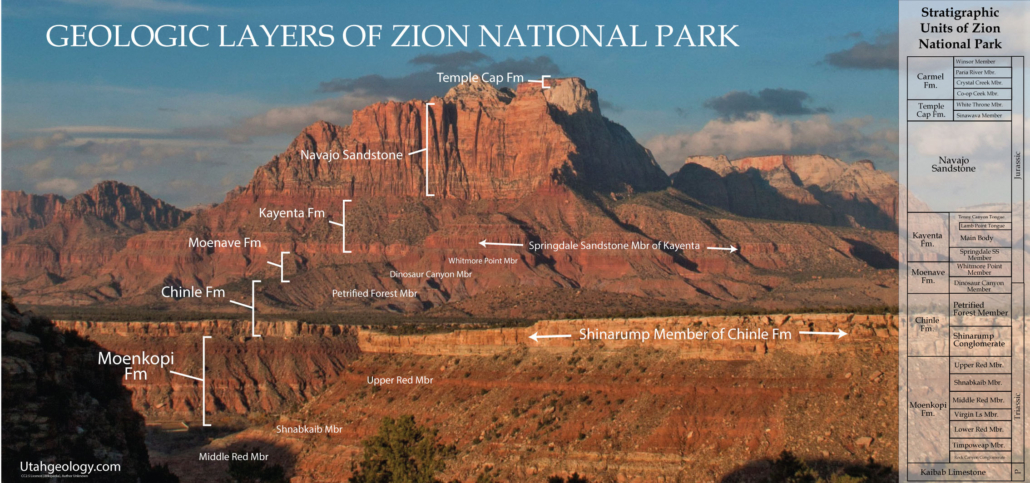
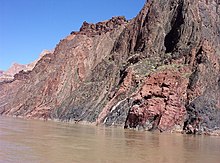
Geologic units of the Grand Canyon mentioned in this article.
.
The Grand Canyon, a mile-deep chasm carved through millennia of Earth’s history, is not merely a spectacle of layered rock; it is a profound archive of ancient life. Within its vibrant strata, beyond the skeletal remains, lie the subtle yet powerful narratives of behavior etched in stone: tracksites and trace fossils. These ichnological treasures, from the uppermost Kaibab Formation down to the basal Tapeats Sandstone, offer unique insights into the locomotion, feeding, dwelling, and resting habits of creatures that roamed these ancient landscapes. This post descends through the Grand Canyon’s formations, highlighting the known track sites and trace fossils that whisper tales of life across vast stretches of time. For many more Grand Canyon region fossil picture, be sure to check out http://www.schursastrophotography.com/. Another fantastic resource is the Grand Canyon-Parashant National Monument Paleo Resource Inventory.
A second purpose for this article is help point the many young-earth creationists I run up against understand why a catastrophic or ‘flood’ deposition of the layers of the Grand Canyon is entirely implausible. Not only does almost every layer in the canyon have fossils and track sites showing fairly uniformitarian principles existed at their deposition, but time anomalous layer around the world have evidences such as fossilized “IN PLACE” forests spanning at least from the Mississippian to Permian ages.
Faunal Succession in the Layers of the Grand Canyon and Grand Staircase. Map is of Utah Mountain area just north of the Grand Canyon, where most Grand Staircase strata is accessible in a short drive along highway 91.
.
Tapeats Sandstone (Cambrian)
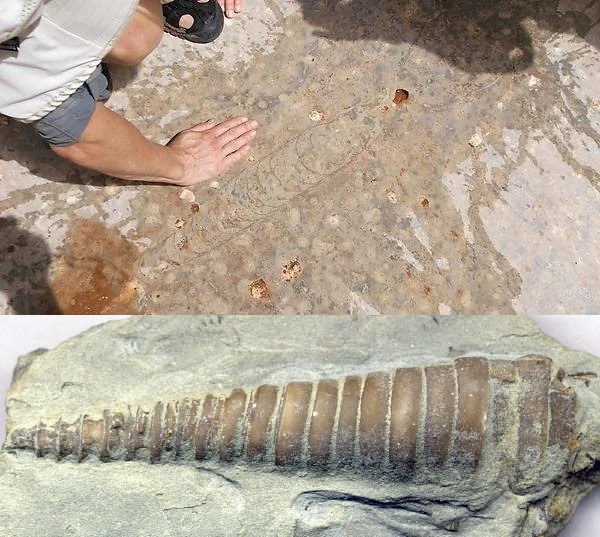
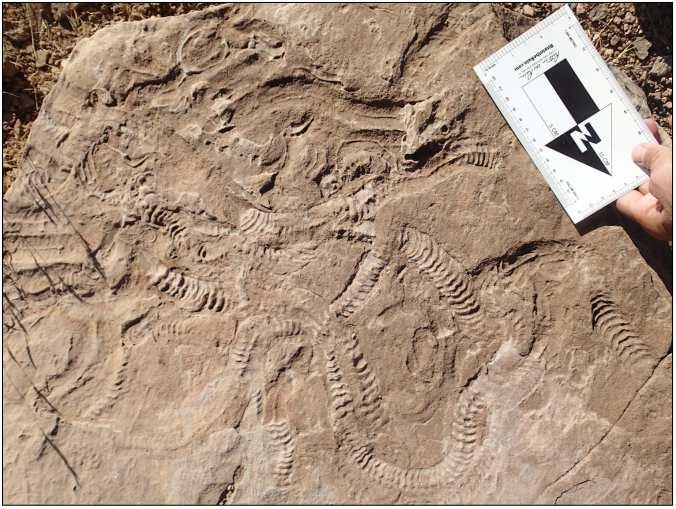
Finally, at the base of the Grand Canyon sequence lies the Tapeats Sandstone (Cambrian), a resistant sandstone deposited in a nearshore marine environment as the ancient sea transgressed across the continent. The Tapeats is characterized by abundant vertical burrows of suspension-feeding worms (Skolithos). These simple, tube-like structures are a hallmark of the “pipe rock” facies and represent one of the earliest widespread records of complex animal behavior in the fossil record. Horizontal trackways and burrows of other early invertebrates are also found, indicating the initial colonization of the shallow marine environment by mobile organisms. The Tapeats Sandstone marks the dawn of the Cambrian explosion in this iconic geological section.
Incredibly rare arthropod trackway from the Tapeats Sandstone.Found near Payson, AZ. See schursastrophotography for more detailed imagesSkolithos, straight vertical burrows from the Grand Canyon’s Tapeats Sandstone near Payson, AZ. See schursastrophotography for more detailed images and top view.
.
Bright Angel Shale (Cambrian)
The Bright Angel Shale (Cambrian), a slope-forming unit composed of shale and siltstone deposited in a shallow marine setting, contains a diverse assemblage of invertebrate trace fossils. Horizontal grazing trails, burrows of various orientations and sizes, and trilobite traces are all well-documented. The finer-grained sediments of the Bright Angel Shale provided an excellent medium for preserving these delicate traces of Cambrian life, offering insights into the feeding strategies and locomotion of early marine organisms.
The underlying Muav Limestone (Cambrian), another significant marine limestone formation, similarly yields primarily invertebrate trace fossils. Horizontal burrows (e.g., Planolites) and vertical burrows (e.g., Skolithos) are common, indicating the presence of early worms and other soft-bodied organisms that colonized the Cambrian seafloor. Trilobite trackways (e.g., Cruziana) and resting traces (e.g., Rusophycus) are also found, providing direct evidence of the movement and behavior of these iconic Cambrian arthropods. The Muav’s trace fossils offer a glimpse into the early diversification of animal life in the marine realm.
.
Temple Butte Fm (Devonian)
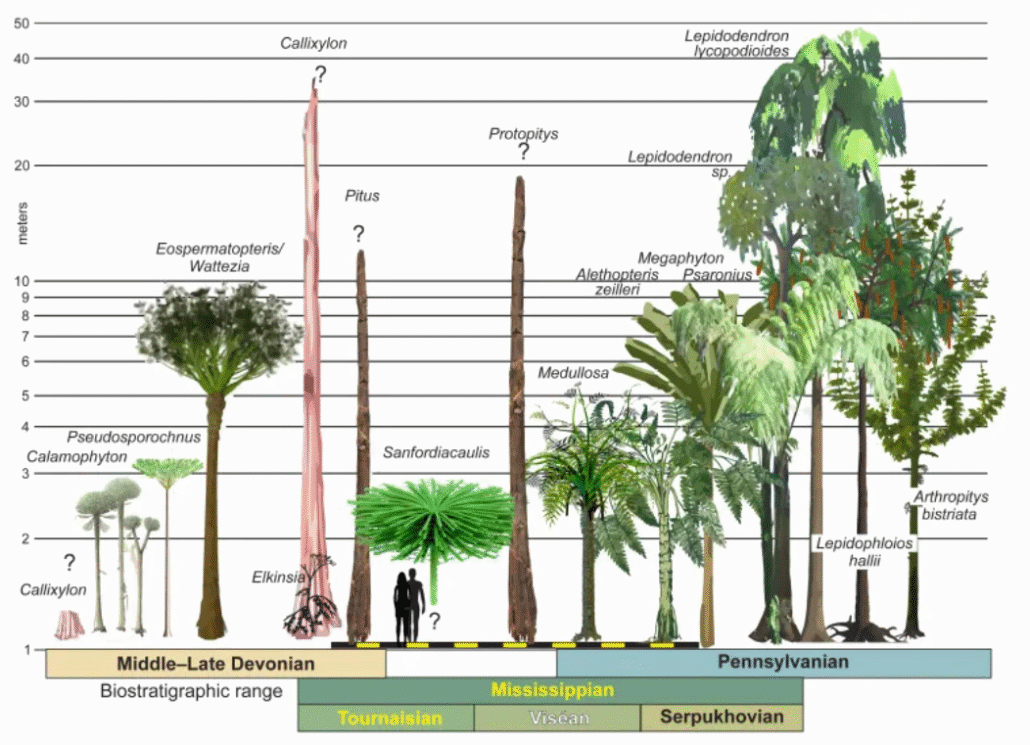
Although the Ordovician, Silurian and Devonian is essentially absent in the Grand Canyon region, it exists with thicknesses over 6,000 feet in Northern Utah and Nevada. The Temple Butte (385mya) is found only in paleo channels carved out in the underlying units and is largely unfossiliferous. But elsewhere in Utah and the world, the Devonian holds the first evidence of fossilized intact growing trees. Once again showing that these units are not part of some catastrophic flood, but sediments deposited under relatively uniformitarian conditions.
Researchers stand next to a pristinely preserved fossil of the root system of Archaeopteris at a fossil locality near Cairo, NY. The oldest evidence of large trees yet found (Devonian ~400mya). Charles Ver Straeten. (see article)A lineup tree progression as seen in the fossil record, comparing their hypothesized sizes and shapes Gastaldo et al., Cell, 2024 under CC BY 4.0 DEEDSome of the earliest tree fossils (Eospermatopteris) from the 385 mya Devonian of New York and Svalbard, Norway (top right).
.
Redwall Limestone (Mississippian)
The Redwall Limestone (Mississippian), a massive cliff-forming unit deposited in a shallow marine environment, is primarily known for its body fossils of marine invertebrates. However, trace fossils are also present, albeit less conspicuous. Burrows of marine worms and other infaunal organisms are commonly found within the limestone beds, reflecting the activity of creatures living on and within the ancient seafloor. Crinoid holdfast attachment scars can also be considered a type of trace fossil, indicating where these stalked echinoderms were anchored. While large vertebrate tracks are absent, the Redwall’s trace fossil assemblage provides evidence of a thriving benthic community in a relatively stable marine environment.
Assortment of Rugose (horn) coral and Tabulate coral community fossils collected from the Redwall Limestone. Bottom right is a CC4.0 image from digitalatlasofancientlife.org showing what similiar Coral communities looked like during the Permian. Redwall Fossil images from Grand Canyon Paleontology.Marine invertebrates from the Mississippian Redwall Limestone, Grand Canyon National Park, Arizona; on the left is a bryozoan, on the right a brachiopod. Left photo and right photo NPS photos by Michael Quinn (Grand Canyon National Park via flickr, Creative Commons Attribution 2.0 Generic license, images cropped and resized).Nautaloid from the ‘death bed’ of the Redwall Limestone of the Grand Canyon (top), bottom is better preserved fossil nautaloid example from elsewhere.Modern bryozoan or ‘sea fan’ (Gorgonia ventalina). Note the delicacy, it will not withstand turbid flow.
.
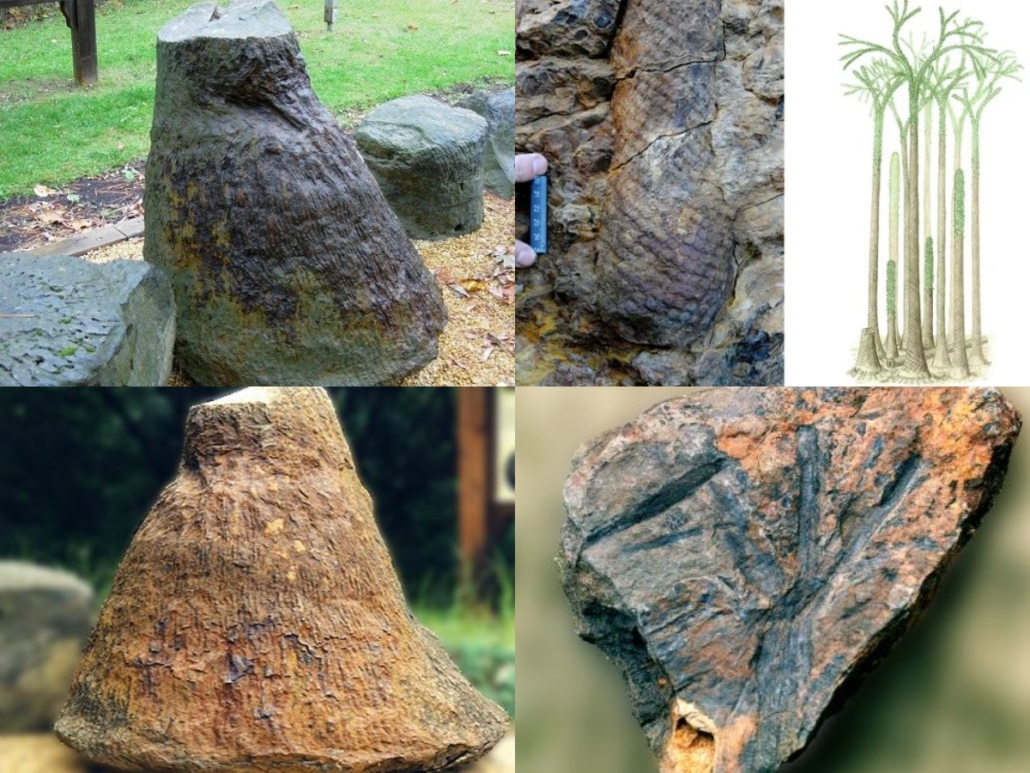
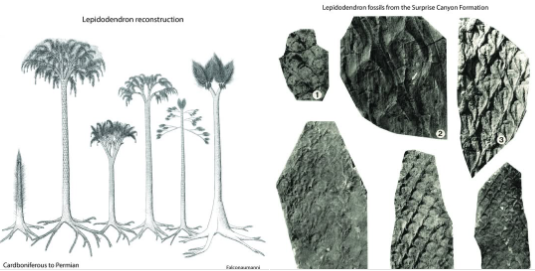
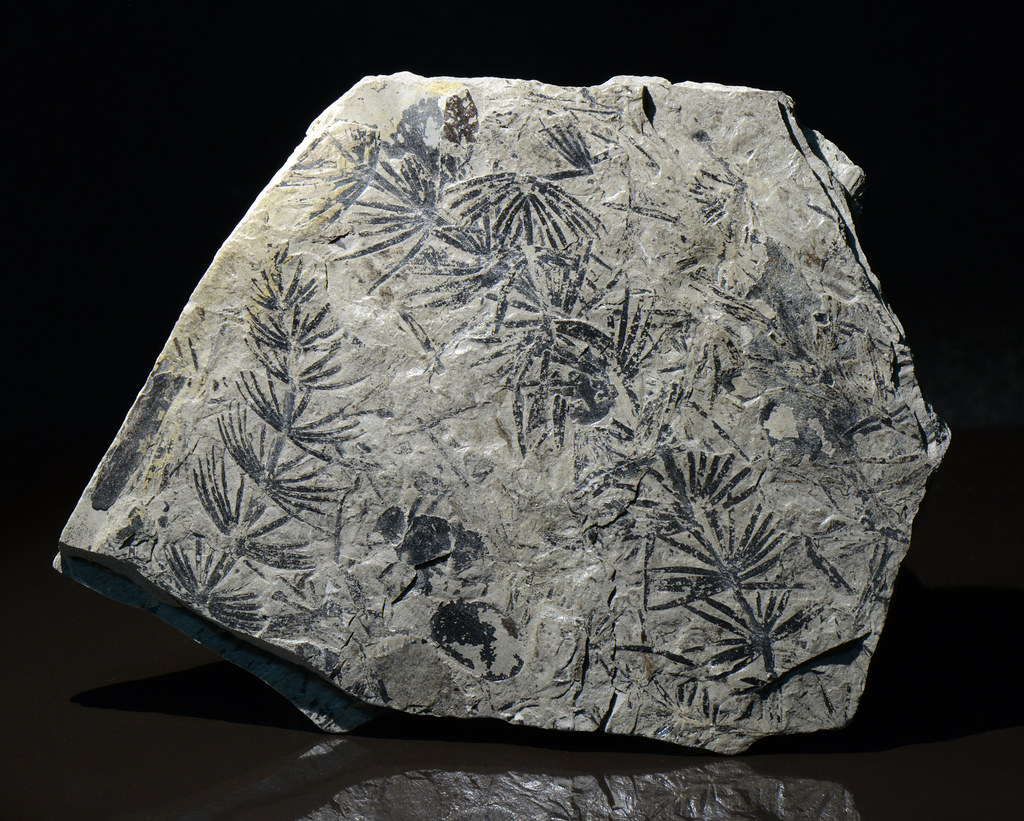
Surprise Canyon Formation (Mississippian)
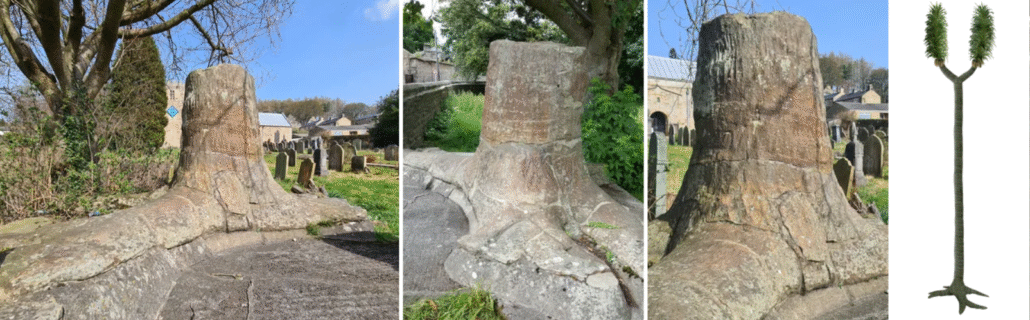
Hidden in small paleochannels carved into the Redwall Formation lies the Surprise Canyon Formation. Before the seas rose and formed an estuary full of sharks and invertebrates, the karst features on top of what is now the Redwall Limestone were filled with rivers and streams. These streams created a lush riparian environment teeming with plants, and not just small shrubs either. Some of these plants belong to the extinct genus Lepidodendron, which were large tree-like plants that grew in wetland environments and reached heights up to 160 feet (50 meters)! Lepidodendron are often known as “scale trees” because of the distinctive diamond shaped pattern of leaf scars along its trunk. Young Lepidodendron plants form a single unbranched trunk with numerous leaves attached to the diamond-shaped bases, and only formed a crown of branches once they neared the end of their lifespan. These trees thrived during the Carboniferous Period and became extinct at the end of the Permian Period.
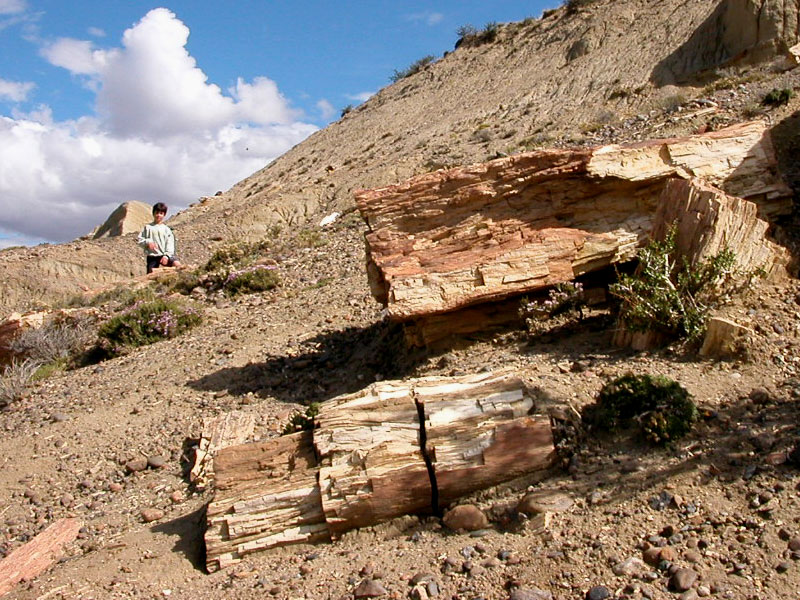
The Chinle & Surprise Canyon Fm are, to my knowledge, the only layers in the Grand Canyon where petrified wood has been found. Although MANY of the layers above and other time equivalent layers elsewhere have tons.
.
Supai Group (Pennsylvanian-Permian)
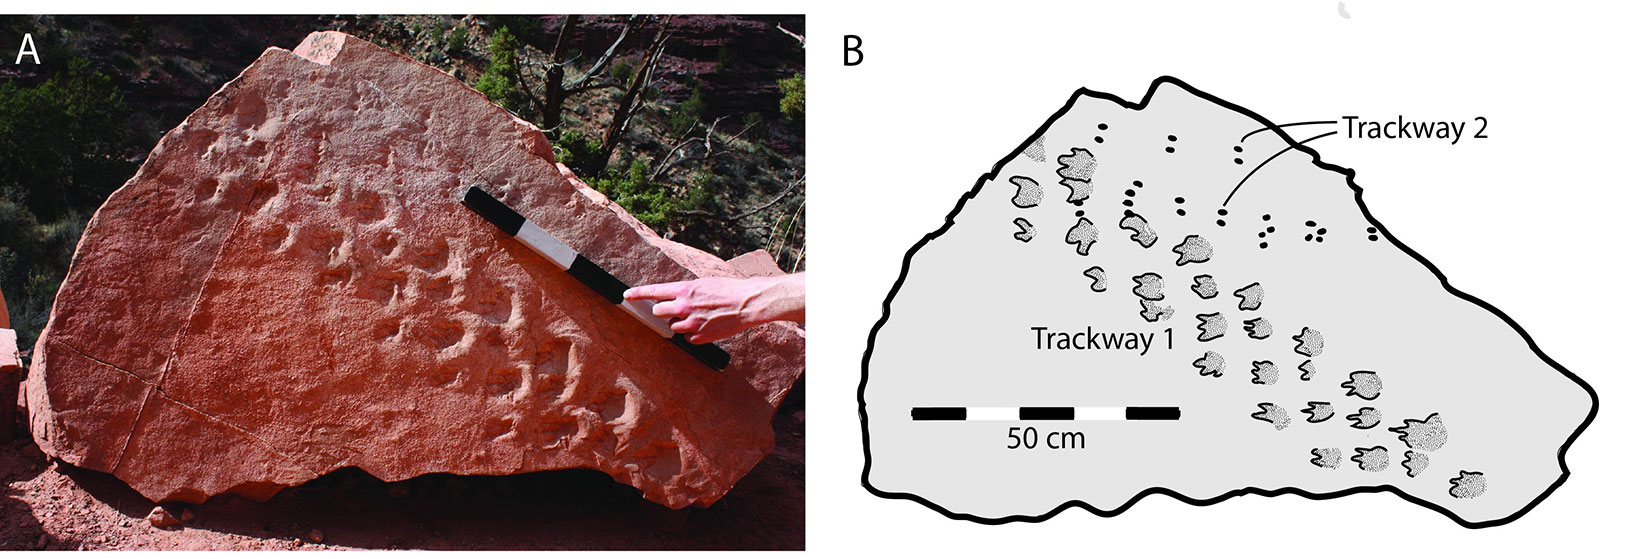
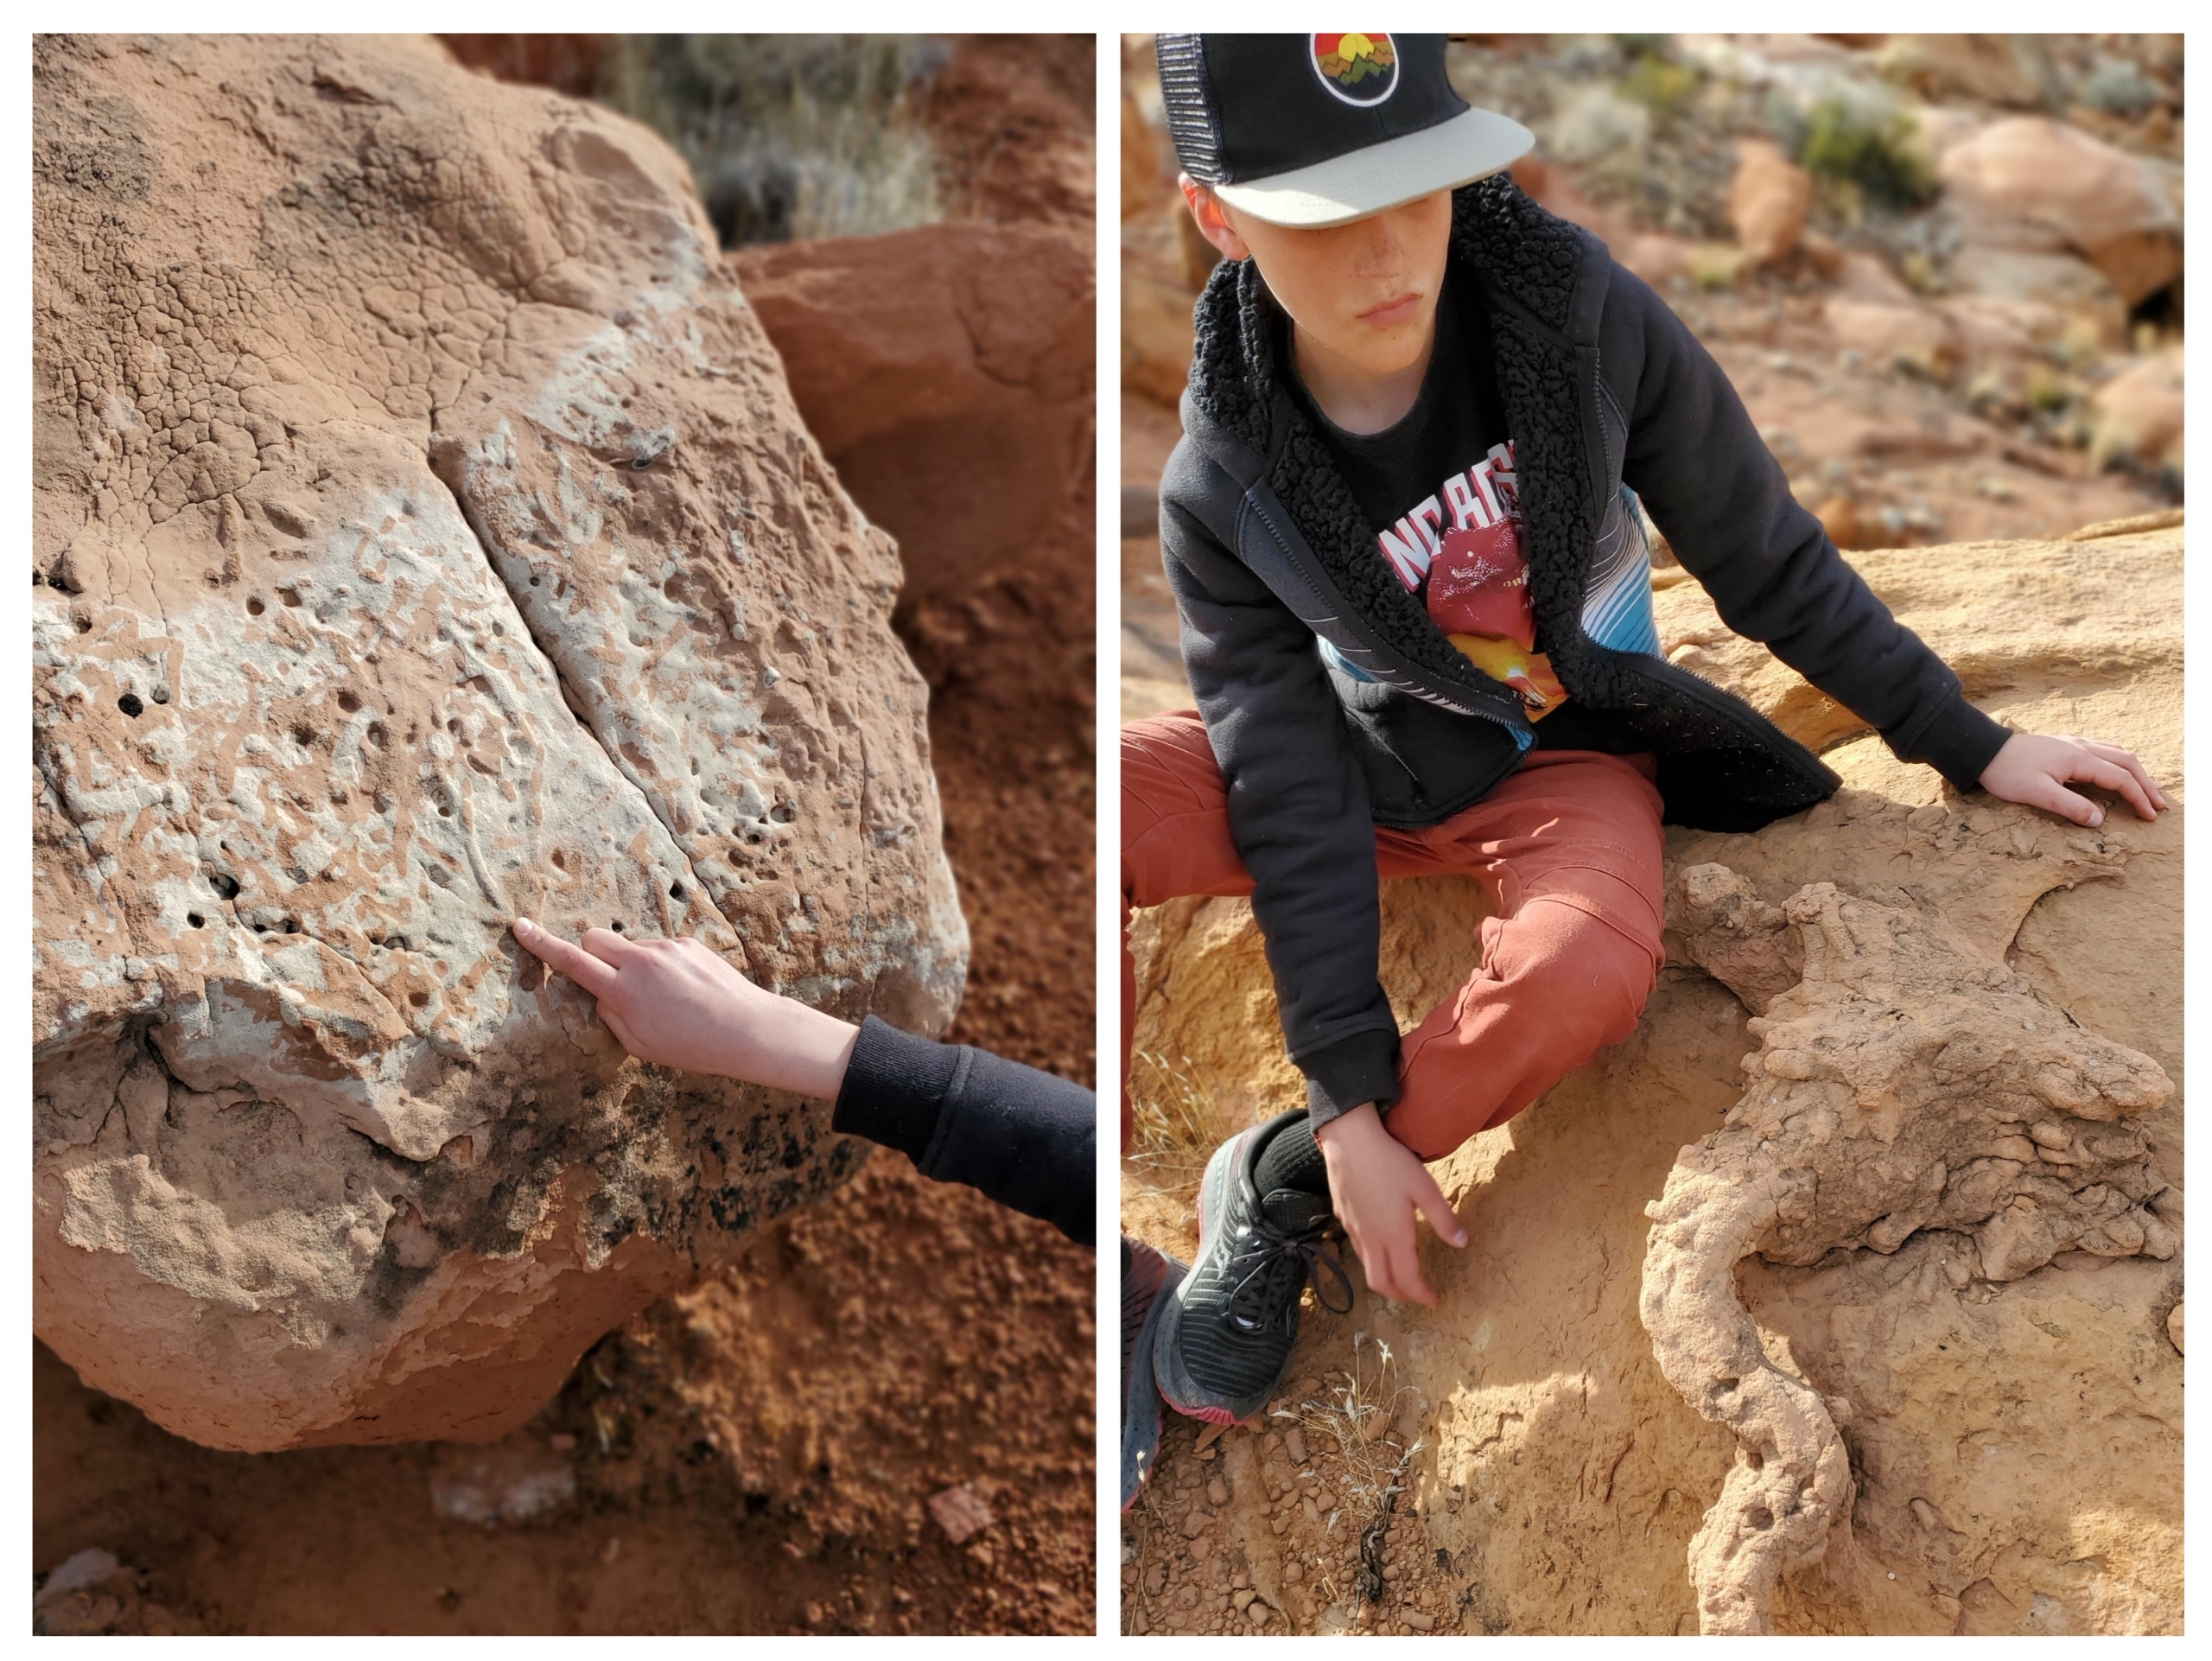
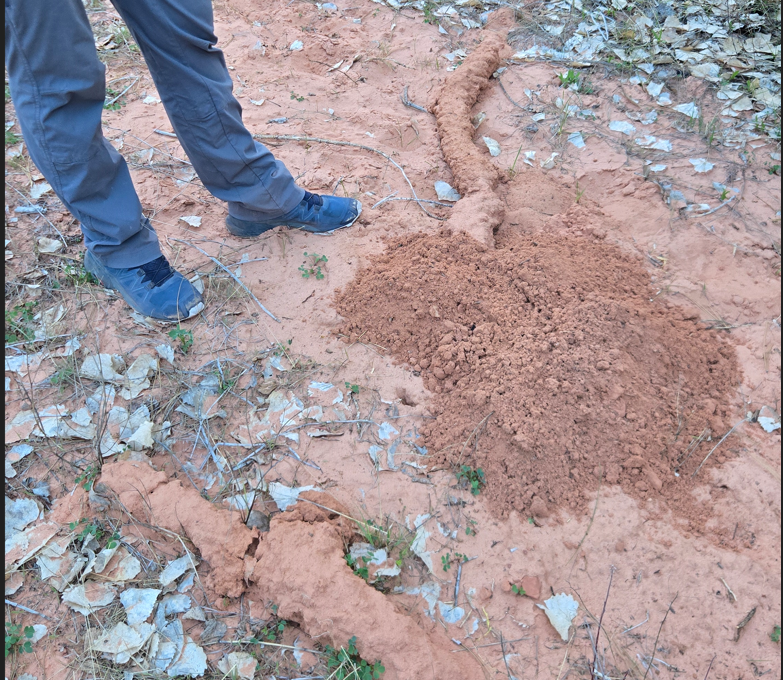
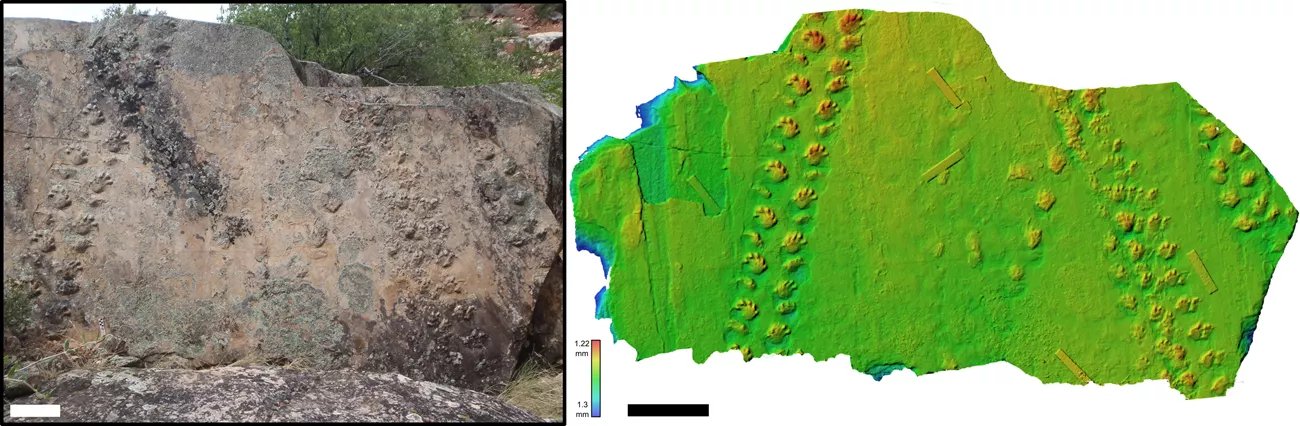
Continuing our descent, the Supai Group (Pennsylvanian-Permian), a thick sequence of sandstones, siltstones, and mudstones deposited in a variety of fluvial, deltaic, and marginal marine settings, reveals an even greater diversity of ichnofossils. Within its various members (e.g., Wescogame, Esplanade, Watahomigi, Manakacha), numerous tetrapod trackways have been discovered, representing a transitional fauna from amphibians to early reptiles. Ichnogenera such as Baropezia, Notalacerta, and various amphibian trackways attest to the presence of diverse terrestrial vertebrates along ancient shorelines and floodplains. Furthermore, the Supai Group is rich in invertebrate trace fossils, including a wide array of burrows (vertical and horizontal), trackways, and feeding traces. These indicate the presence of worms, arthropods, and possibly early mollusks inhabiting both terrestrial and aquatic environments. The varied depositional environments of the Supai Group have preserved a complex tapestry of ancient life and behavior.
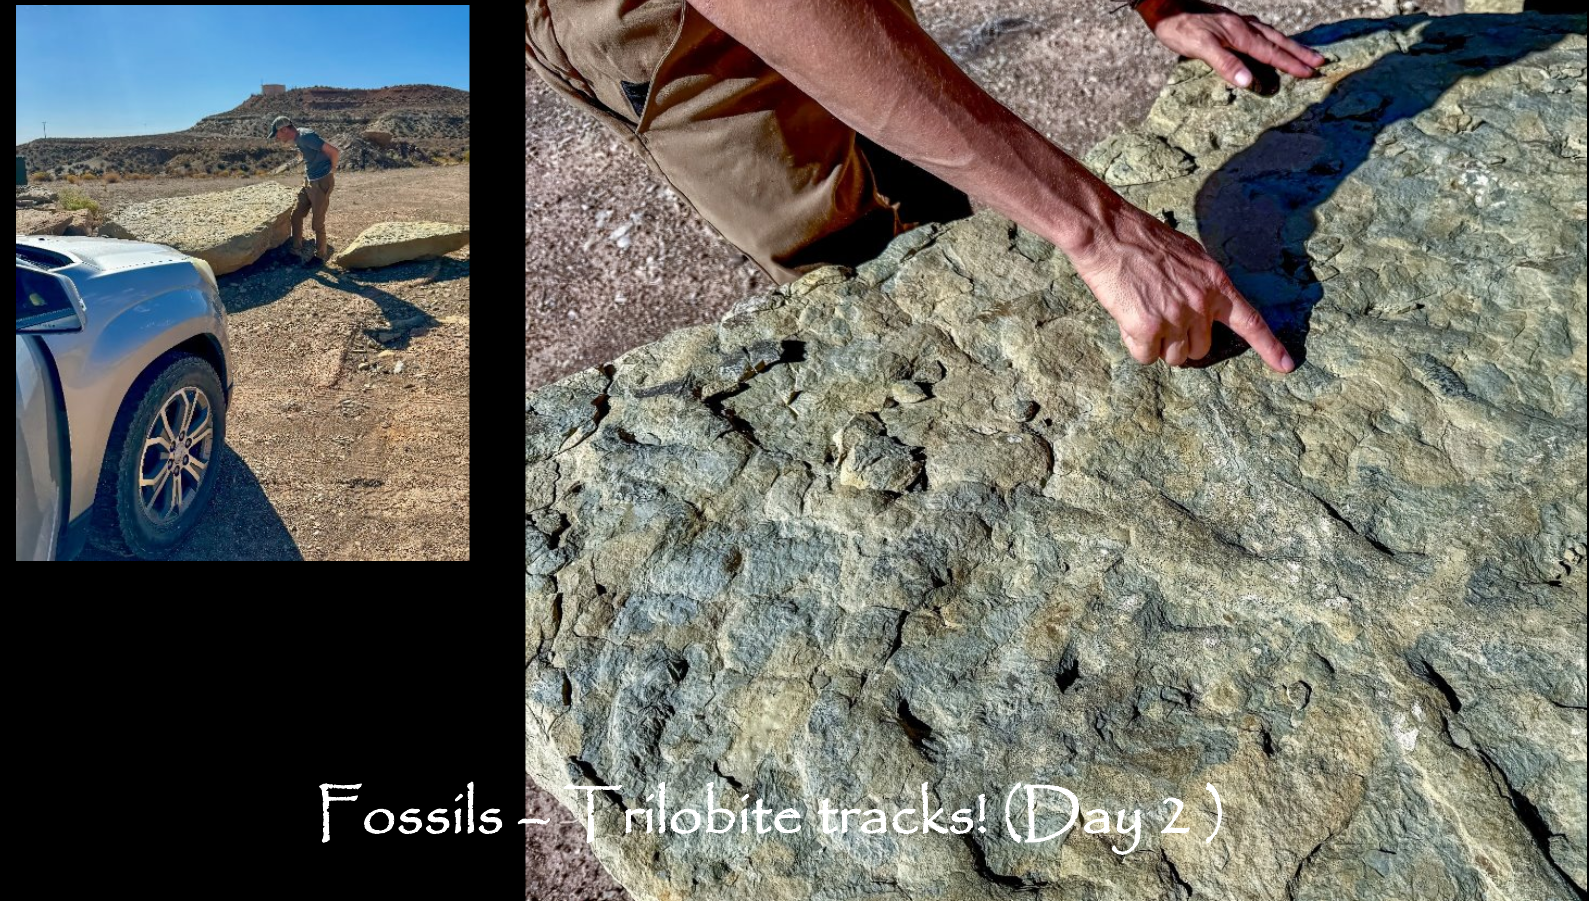
Fossils from the Honaker Trail Fm along the San Juan River near Mexican Hat. Equivalent rocks to the Wesgogame Fm of the Supai in the Grand Canyon. (Bottom center is a museum sample to show what intact crinoids at top left would have looked like)Pennsylvanian vertebrate tracks from the Manakacha Formation, Supai Group, Grand Canyon National Park, Arizona. Photo of the tracks (A) and drawing of the same specimen (B). Scale is in decimeters (1 decimeter = 10 centimeters = about 3.9 inches). Figures 2A and 2B from S. M. Rowland, M. V. Caputo, and Z. A. Jensen (2020) PLoS ONE 15(8): e0237636 (Creative Commons Attribution 4.0 International license, image cropped).Both small and large burrows from the upper Supai Group. Just north of Grand Canyon (Virgin River Gorge).Unmistakable modern gopher/vole burrows created under the winter snow. Compare how similiar these are to ancient burrows seen in the fossil record (usually created in soft muds and filled with slightly harder sandstone.Large, well-preserved invertebrate trace fossils (Psammichnites likely Trilobite tracks isp.) in the Supai Group (Wescogame Formation?) of Grand Canyon-Parashant National Monument. Scale bar is in cm. Photo by Rose Weeks (from NPS Resource Inventory)
While the Watahomigie Formation of the Supai Group was being deposited in the Grand Canyon, conifer forests were growing and being buried and fossilized in the Eastern US & England. In fact much of Europe and North America’s substrate trees and minable coal mines come from the ‘Carboniferous Period’ (Mississippian and Pennsylvanian 360-300 mya). This is speculated to be caused by major ice-age induced sea level changes at the time. In Utah and the Grand Canyon region however, most coal is found in the Cretaceous period. Nearly 200 million years later. Why? Likely because by that time the climate in Utah was now similiar to that in England/New England of the Carboniferous, and once again sea level was rapidly changing.
The Stanhope Fossil Tree, in In St. Thomas’s churchyard, Stanhope north-central England dates to the Carboniferous Period 320 mya, the same age as the Supai Group of the Grand Canyon.David Webster of The Fossil Grove Trust at Fossil Grove, Victoria Park, Glasgow. The tree stumps stand where they were formed 325 million years ago when land that is now Glasgow was found close to the equator, near Brazil. PIC: John Devlin MANY footprints, leaf impressions and fossils exist in a similiar park in east Fife Scotland (see link here).Several trackways the first bay is also host to a range of other fossils, in particular a large tree stump and ripple marks formed in the Carboniferous sediment in east Fife Scotland (see link here).1918 photo of an intact tree stump in an Eastern US? coal mine dating to the Carboniferous age circa 300 million years ago. Petrified wood in INCREDIBLY common in coal mines.
.
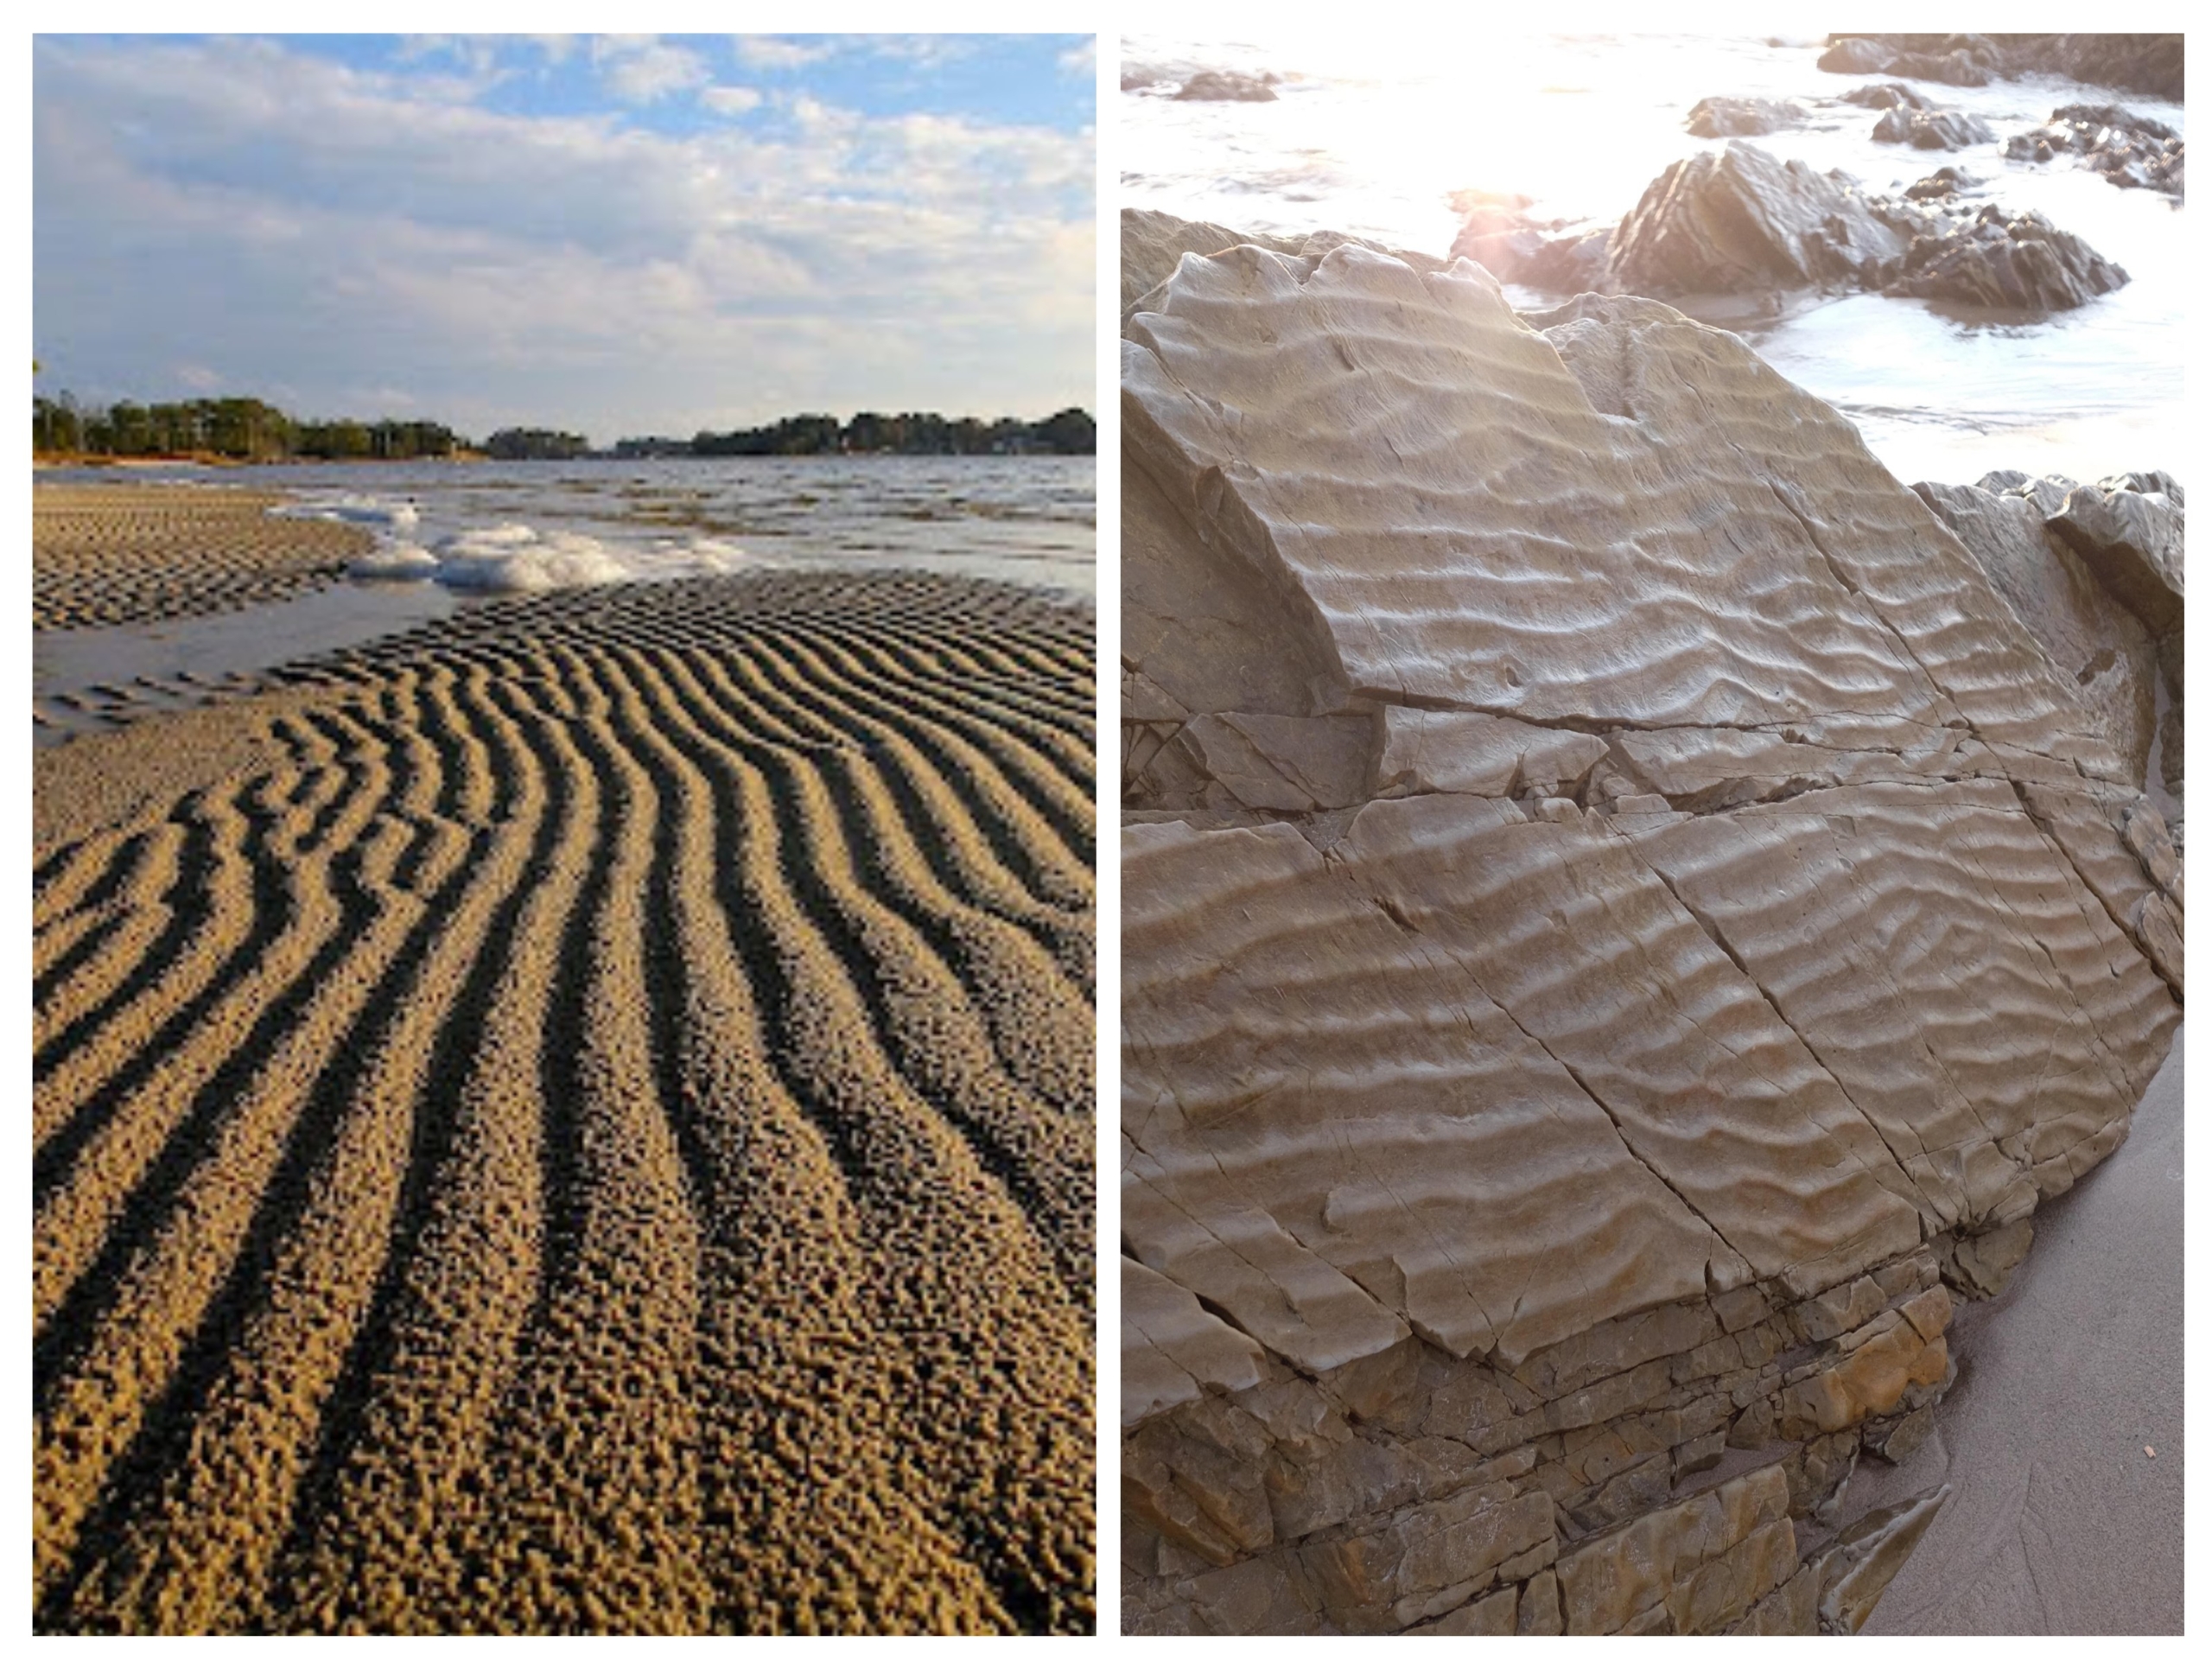
Fossil ripples vs modern ripples. Ripples are the most common type of bedform and often contain tracks and worm traces just like you see on modern shorelines, proving the uniformitarian processes at work when the rock was deposited.Modern mud cracks (left), and fossil mud cracks (right) found in many, many different layers of the Grand Canyon. Once again proving the uniformitarian subaerial processes at work when the rock was deposited.
.
Hermit Formation (Permian)
The transition to the underlying Hermit Formation (Permian) marks a shift towards a more fluvial (riverine) and lacustrine (lake) environment, evidenced by its interbedded sandstones, siltstones, and shales. The ichnological record of the Hermit Formation reflects this change, showcasing a broader range of trace fossils. Tetrapod trackways, though perhaps less ubiquitous than in the Coconino, are still present, indicating continued habitation by early reptiles and amphibians. However, the Hermit is particularly notable for its insect trackways and resting traces, providing rare glimpses into the activity of terrestrial arthropods of the Permian. Delicate trails and impressions left by insects crawling across soft sediment have been documented, offering a unique perspective on the terrestrial invertebrate fauna of this period. Additionally, burrows and trackways of aquatic invertebrates are found in the finer-grained sediments, reflecting the presence of ancient waterways and lakes.
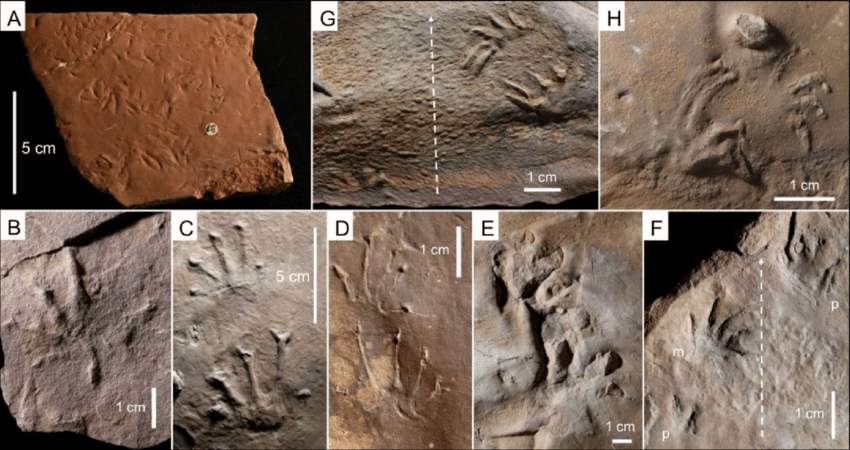
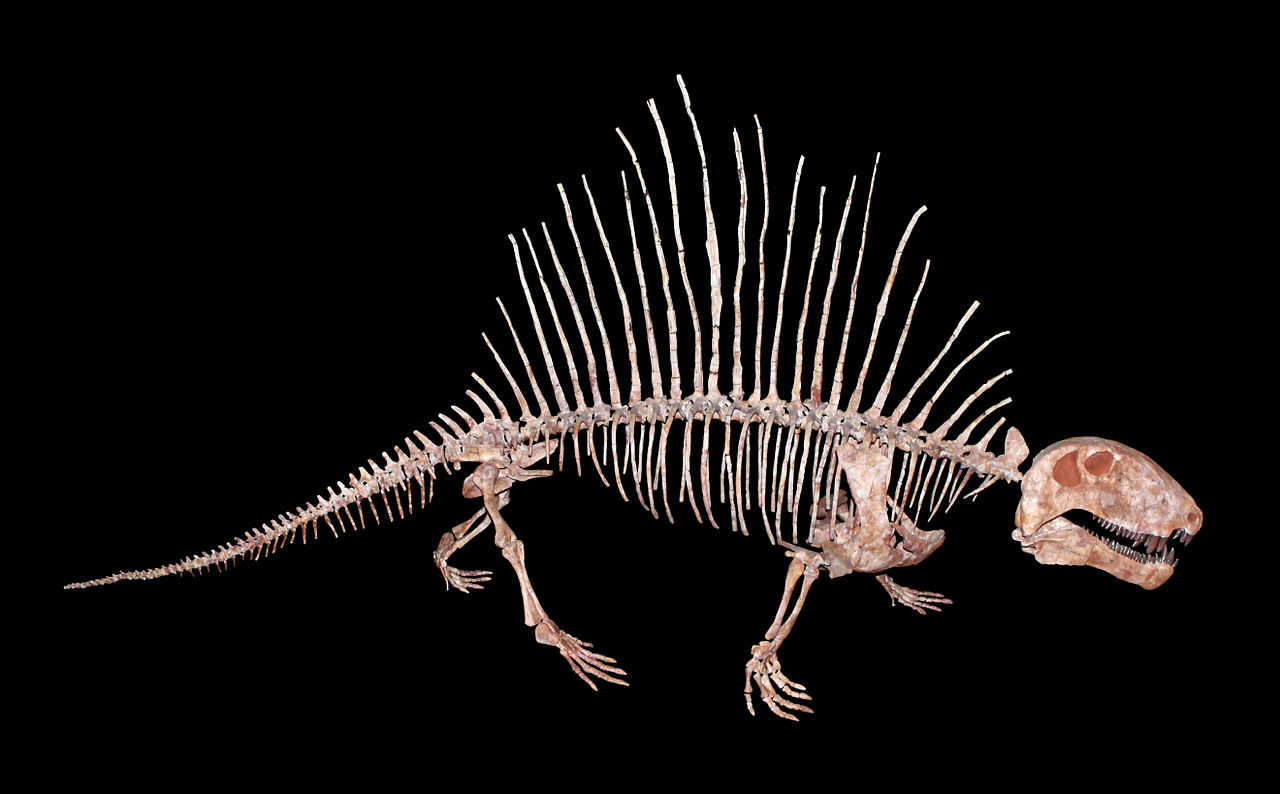
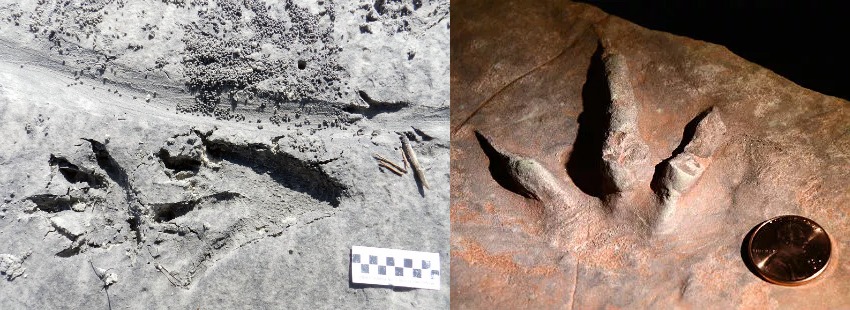
Reptile footprints from the Hermit Shale (LORENZO MARCHETTI & SPENCER LUCAS). A. GRCA 3171, Yaki Trail. Dromopus lacertoides, several footprints, concave epirelief. B. UCMP-V 4010C, Mogollon Rim. Dromopus lacertoides, left footprint, convex hyporelief. C. USNM 11518, Hermit Trail. Holotype of Hyloidichnus bifurcatus Gilmore 1927, left pes manus couple, convex hyporelief. D. USNM 11692, Yaki/South Kaibab Trail. Hyloidichnus bifurcatus, left pes manus couple, concave epirelief. Holotype of Hyloidichnus whitei Gilmore 1928. E. UCMP-V 75216G, Mogollon Rim. Hyloidichnus bifurcatus, left pes manus couple, concave epirelief. F. UCMP-V 75216D, Mogollon Rim. Erpetopus isp., partial trackway, convex hyporelief. G. UCMP-V 75216A, Mogollon Rim. Erpetopus isp., left pes manus couple, convex hyporelief. H. UCMP-V 75209A, Hermit Trail. Erpetopus isp., partial trackway, convex hyporelief. Dashed arrows indicate the direction of progression. p=pes imprint. m=manus imprint. (from Marchetti et al)Unidentified seed fern fronds (leaves) from the Permian Hermit Shale, Grand Canyon National Park, Arizona. Left photo and right photo by Michael Quinn (Grand Canyon National Park via flickr, Creative Commons Attribution 2.0 Generic license, images cropped and resized).A few of many drawers of ferns and other plants collected from the Permian Hermit Formation, most of which were collected by David White in the 1920s.Dragonfly wing (right) found in Hermit Shale in Grand Canyon of species T. whitei, a complete specimen of the same age shown (left) from Kansas. Some grew to be 28 inches in length (although these are about 8in).Dimetrodon fossil from the Permian basin of Texas & Oklahoma lived west of the Grand Canyon during the deposition of the Hermit Shale, & Coconino Sandstone.
.
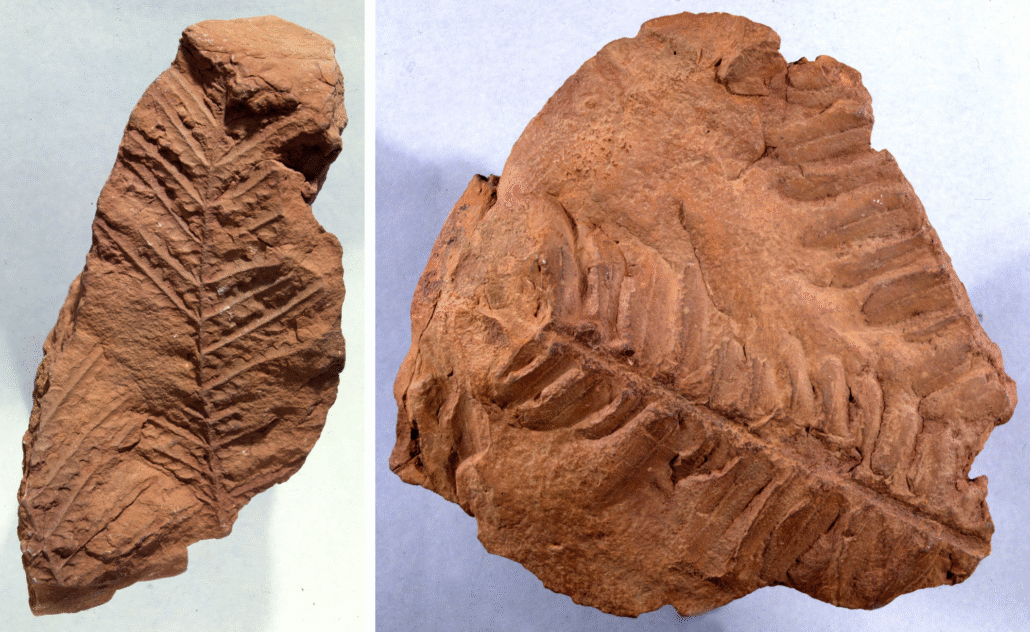
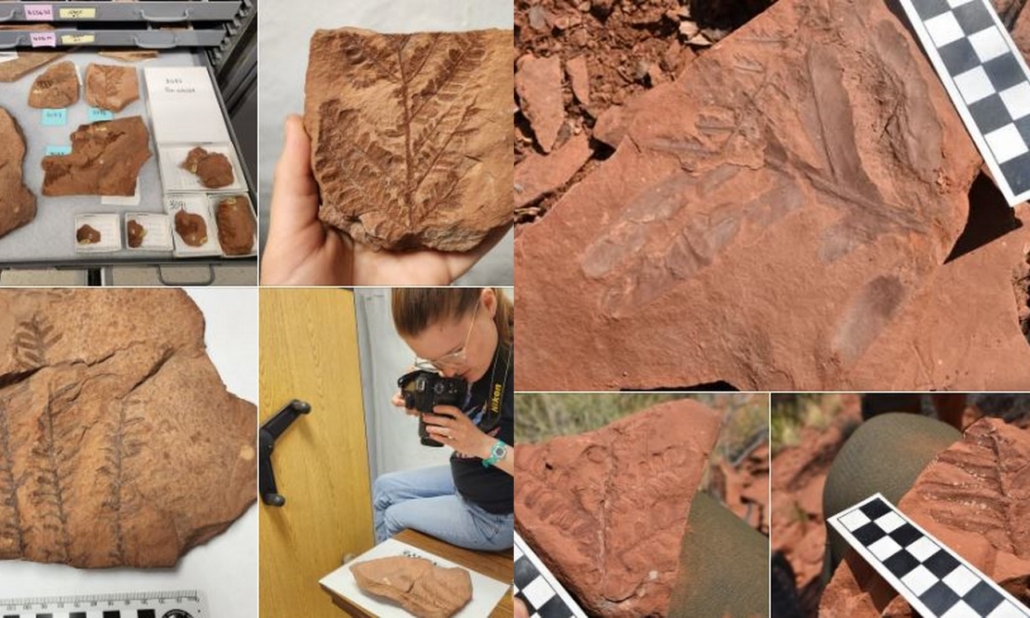
Schnebly Hill Formation (Permian)
The Schnebly Hill Formation is primarily exposed in the Sedona area along the western Mogollon Rim (50 miles south of the Grand Canyon). It consists of cross-bedded sandstones, mudstones, limestones, and evaporites deposited in a mix of eolian, coastal, and shallow marine environments within the Holbrook Basin. It sharply overlies the Hermit Formation (or Hermit Shale) in the Sedona region and intertongues upward with the Coconino Sandstone, reaching thicknesses of 300–600 m eastward but thinning westward to the point of pinching out just east & south of the Grand Canyon. (But still occupying a time period between the Coconino Sandstone and Hermit Formation. It contains many impressive marine & terrestrial fossils, as well as track sites.
Reptile trackway in the Schnebly Hill Formation Sadona, Near fortress ruin Loy Canyon Trailhead just south of the Grand Canyon.Asterophyllites or Annularia, a type of horsetail fern from the Schnebly Hill Formation south of the Grand Canyon.
.
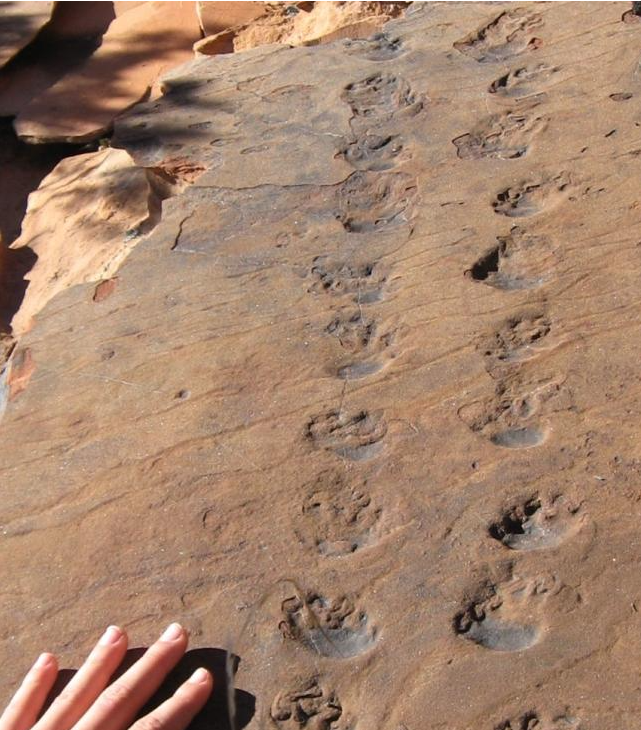
Coconino Sandstone (Permian)
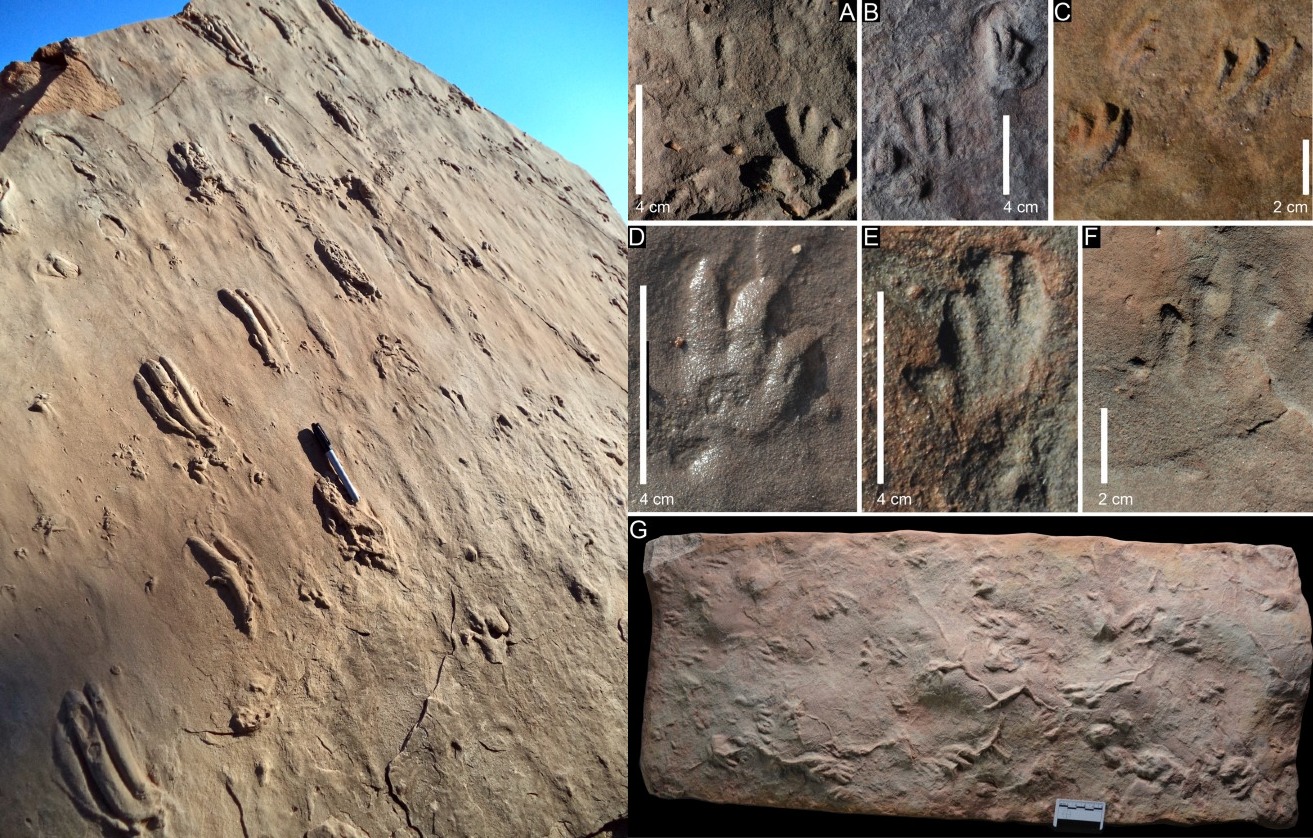
Beneath the Toroweap lies the striking Coconino Sandstone (Permian), a massive cross-bedded sandstone representing an extensive ancient sand sea (erg). This formation is renowned for its exceptional preservation of tetrapod trackways. The fine-grained, wind-deposited sands acted as an ideal medium for recording footprints, which were subsequently buried and lithified. Numerous track sites within the Coconino have yielded a rich diversity of ichnogenera, including Chelichnus, Dromopus, Laoporus, and Octopusoides. These trackways provide invaluable insights into the gait, size, and behavior of early reptiles and possibly synapsids (the lineage leading to mammals) that navigated these ancient dunes. The consistent direction of many trackways suggests prevailing wind patterns, further painting a vivid picture of this Permian desert environment. While invertebrate traces are less common in the dominant eolian facies, evidence of burrowing organisms can be found in interdune or wetter intervals. The Coconino stands as a global benchmark for understanding early terrestrial vertebrate locomotion.
A fallen boulder of Coconino Sandstone located adjacent to the Dripping Springs Trail shows trackways of a tetrapod, or mammal-like reptile, that walked on the sand dune and predated the dinosaurs. The tracks are enhanced by a false-color depth map (depth in mm).(TOP: FRANCISCHINI ET AL. (2019); BOTTOM: SPENCER LUCAS).Artwork depicting the Coconino desert environment and two primitive tetrapods, based on the occurrence of Ichniotherium from Grand Canyon National Park.Illustration courtesy of Voltaire Paes Neto.Small beetle trackway in the Coconino Sandstone of the Grand Canyon. Both bottom left and top right also have other insect tracks as well (possibly spiders?)
.
Toroweap Formation (Permian)
Descending through the Toroweap Formation (Permian), a transitional unit representing fluctuating marine and terrestrial influences, the ichnological record begins to diversify. The Whitmore Wash Member, often considered a temporal equivalent to the Coconino Sandstone, exhibits abundant trackways of tetrapods. These footprints, often preserved in fine-grained sandstones and siltstones, reveal the presence of early reptiles and amphibians traversing dune-like environments or marginal marine flats. Genera like Chelichnus and Dromopus, characteristic of early amniotes, have been identified, providing crucial evidence of the fauna inhabiting this transitional landscape. Additionally, invertebrate traces such as burrows and trackways continue to be found, reflecting the persistence of benthic communities in the changing environments. Aside from the Whitemore Wash Member/Coconino, the Toroweap Formation is comparatively unfosiliferous, with fossils limited to invertebrates in a few limestone horizons and the trackways of the Whitmore wash.
Tiny Schizodus bivalves from a marine lens of the early Permian Toroweap Formation.
.
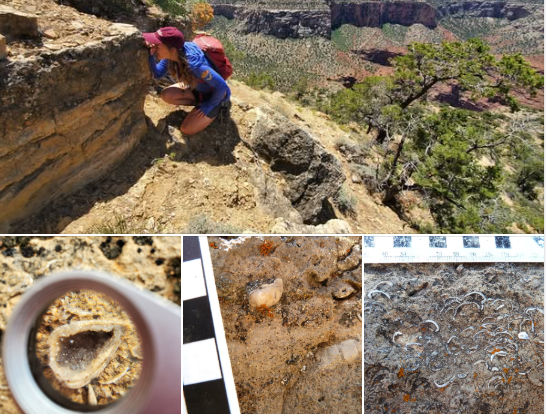
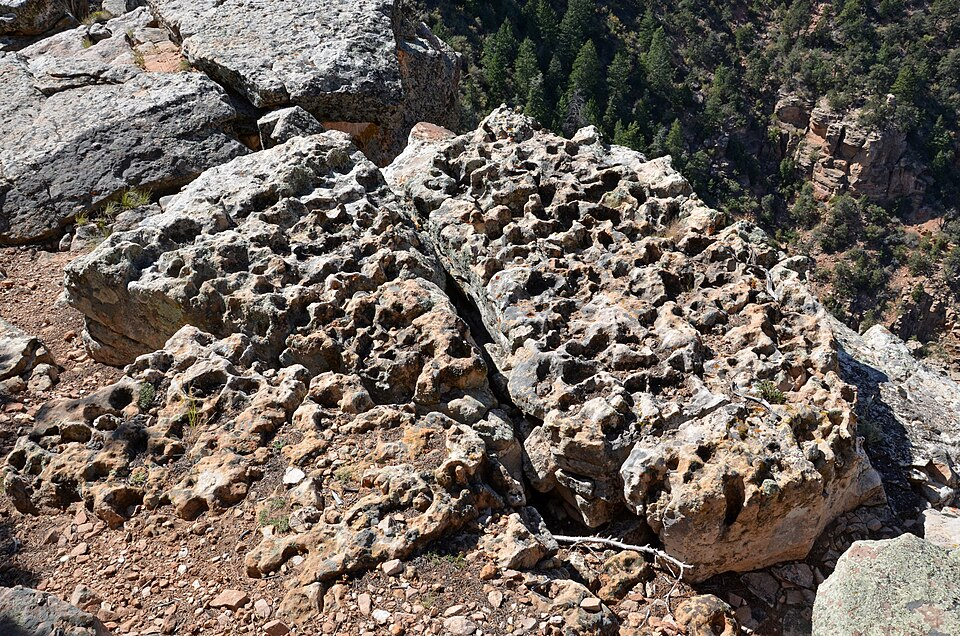
Kaibab Formation (Permian)
At the canyon’s rim, the Kaibab Formation (Permian), a resistant limestone deposited in a shallow marine environment, might seem an unlikely place for abundant tracksites. However, careful examination reveals evidence of invertebrate activity. Trace fossils such as burrows (e.g., Planolites, Palaeophycus) and grazing trails are documented, indicating the presence of worms and other soft-bodied organisms that moved through the muddy seafloor. While large vertebrate tracks are less common in the main canyon exposures of the Kaibab, equivalent formations outside the immediate Grand Canyon region have yielded footprints of early reptiles, suggesting the potential for future discoveries within its upper layers. The Kaibab’s story is primarily one of a marine ecosystem, its trace fossils reflecting the simple yet persistent life within those ancient seas.
Dissolved chertified burrows (likely from shrimp or other crustaceans) from the Kaibab formation on the rim of the Grand Canyon.Coral Reef community fossils associated with patch reef/burrowed areas, all gathered by the present author from a small canyon in the Kaibab. Fossils include brachiopods, bryozoans (sea fans), sponge, crinoids, corals and clam shells. Lance Weaver
.
.
Fossils of Zion & Bryce National Park Layers
Mesozoic Layers Just North of Grand Canyon
The Moenkopi and Chinle formations which stratigraphically sit just on top (just younger) than the layers of the Grand Canyon have many, many impressive trace fossils.
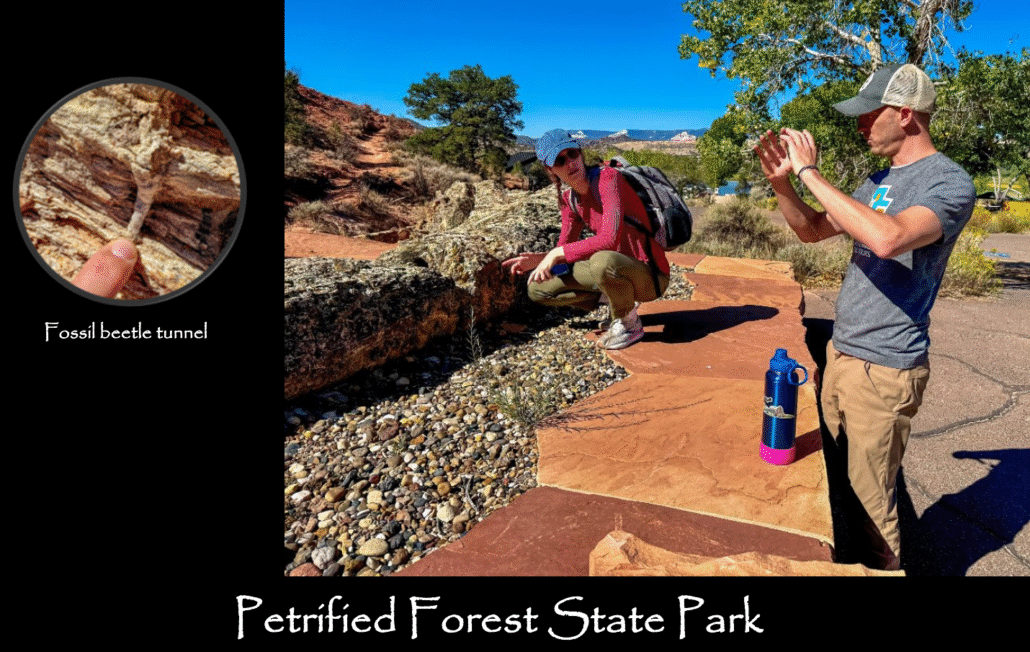
Cruziana trackways from the Virgin Limestone member of the Moenkopi Formation just north of Virgin, Utah just north of the Grand Canyon. Well preserved petrified fire-scarred fossil tree from the Late Triassic Chinle Fm of Petrified Forest National Park. (see article here)Dinosaur tracks in the Triassic Moenkopi Formation from Capital Reef and Holbrook Member of the Chinle Groups. See details here.
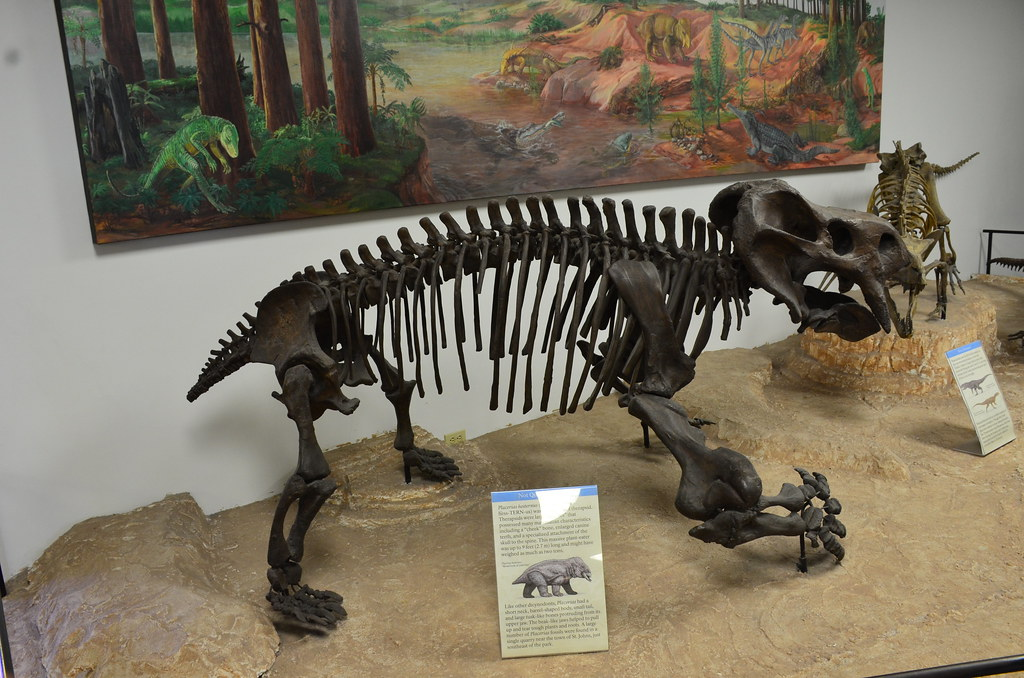
Although they are very rare, Placerias fossils have been found in the Blue Mesa Member of the Chinle Formation within Petrified Forest National Park. Placerias are a type of dicynodont that lived during the Late Triassic Period. These herbivores grew to be up to 11ft long and a ton in weight with two short tusks like a boar or saber-toothed tiger. Once thought to be reptilian, complete skeletons show a far more mammal-like anatomy similar to the Therapsids of the Permian.
Terrestrial Placerias fossil from Triassic Chinle Formation south of the Grand Canyon near St Johns Az.
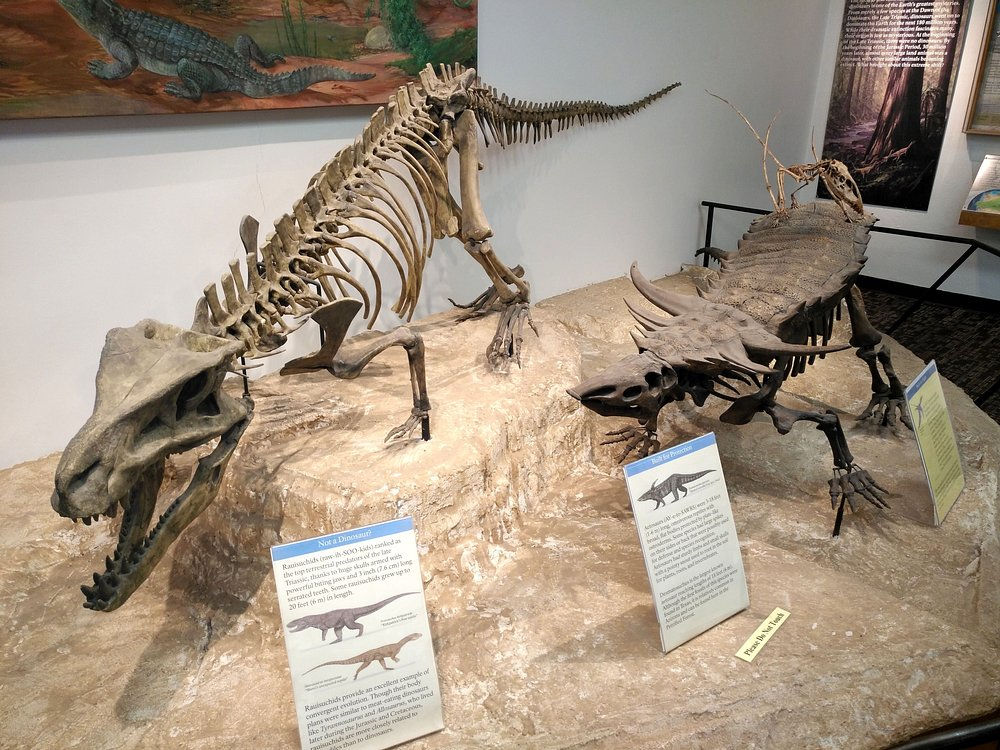
The fact that Therapsid-like fossils as big as Postosuchus (shown below) appear as early as the Chinle in the Late Triassic shows either how quickly things diversified after the Terminal Permian Extinction or that many unknown clades lived before and then through the extinction. Desmatosuchus (on the right) was a large crocodile-like reptile measuring 15 – 16 ft long and weighing about 620–660 lb.
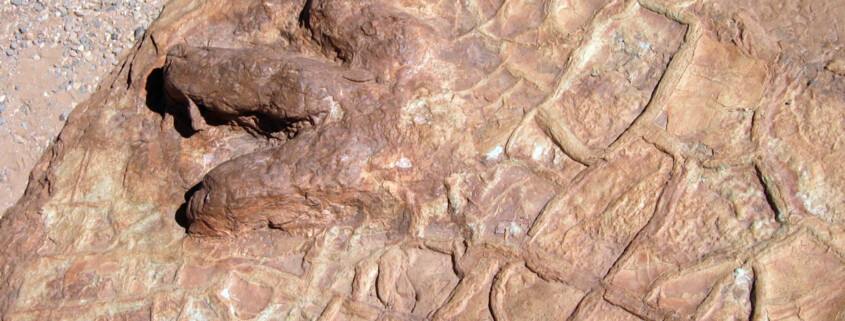
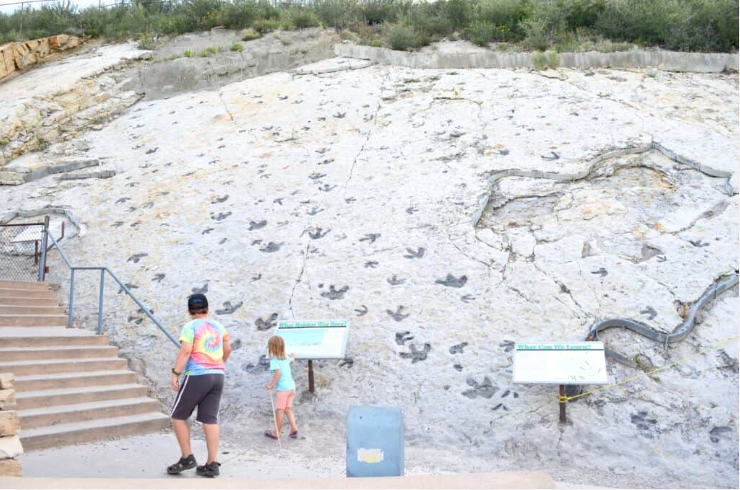
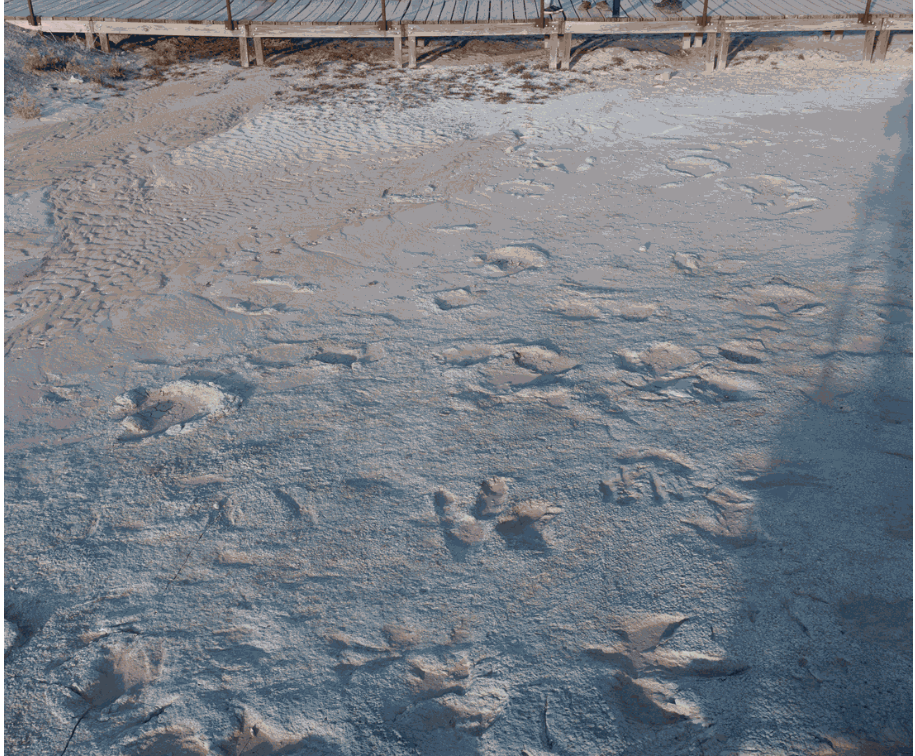
Although true ‘dinosaur’ footprints don’t exist in the Grand Canyon or any Grand Canyon aged (Paleozoic) layers, numerous dinosaur track sites exist in the slightly younger Mesozoic layers just north of the Grand Canyon region. One of the best might be the Dinosaur Discovery Site (tracksite museum) at Johnson Farm in St George, Utah about 70 miles north of the Grand Canyon. (you can explore the museum 100% virtually at this link)
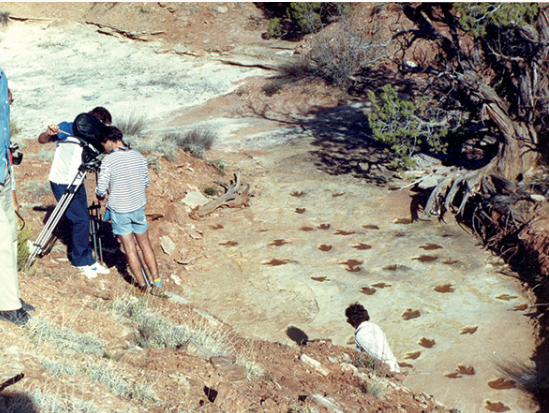
One of the many, many huge slabs of terrestrial and shallow lake deposits with vivid dinosaur tracks.Three toed therapod/eubrontes dinosaur footprint surrounded by mudcracks from the Moenave Formation near St George, Utah north of the Grand Canyon.Modern alligator tracks (left) compared to Triassic Grallator track (right) from Zion National ParkTracy Thomson points to chirotheriid swim tracks in the Torrey Member of the Moenkopi Formation in the Island in the Sky District of Canyonlands National Park. (ugs website)
.
.
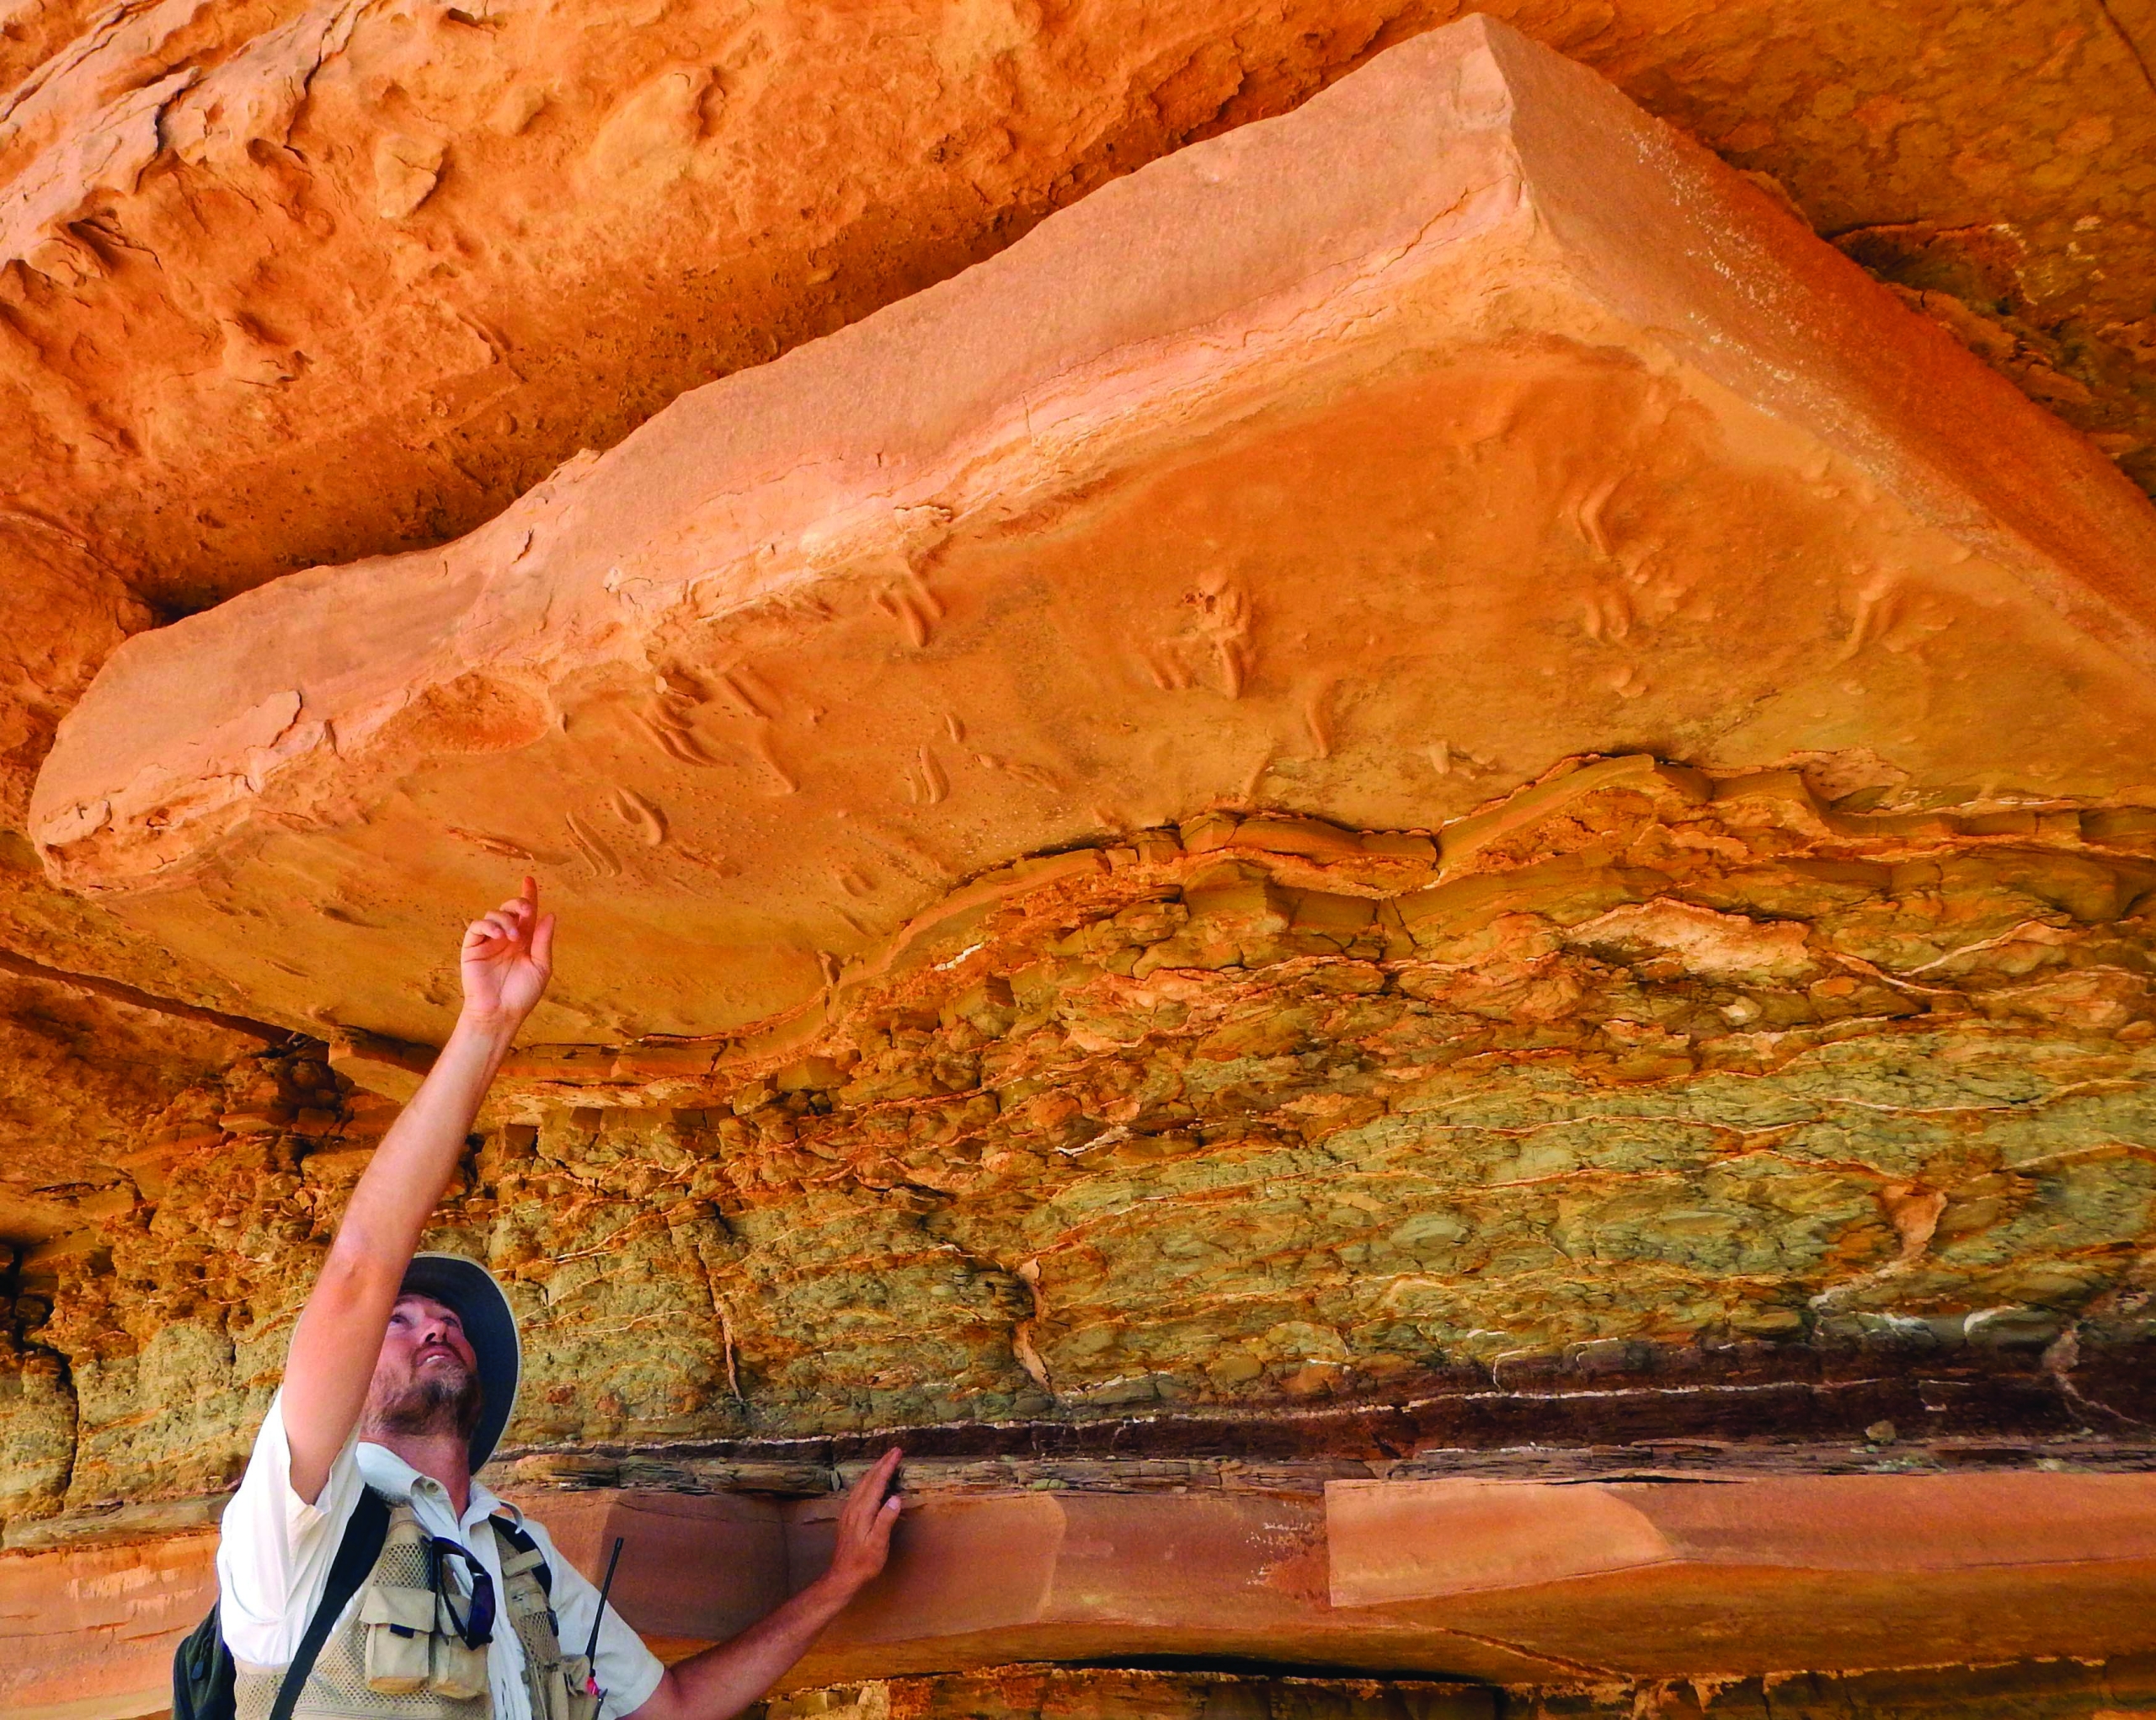
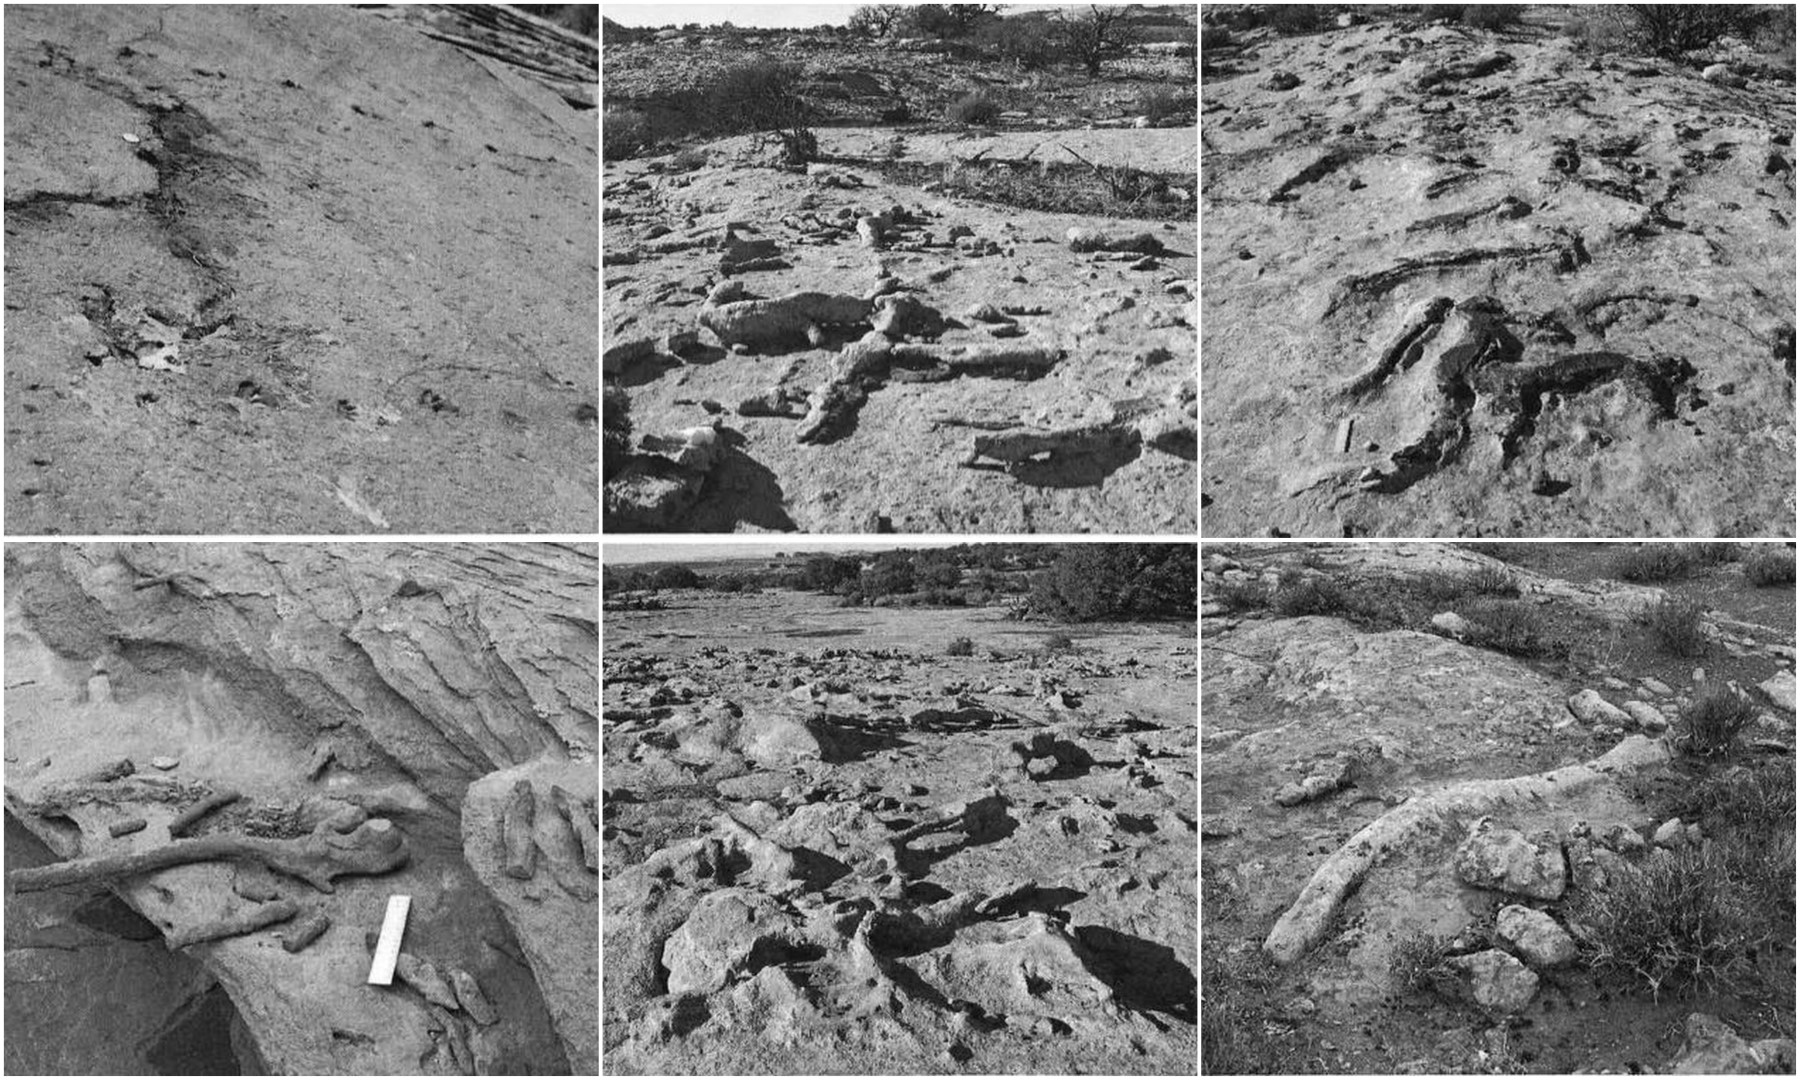
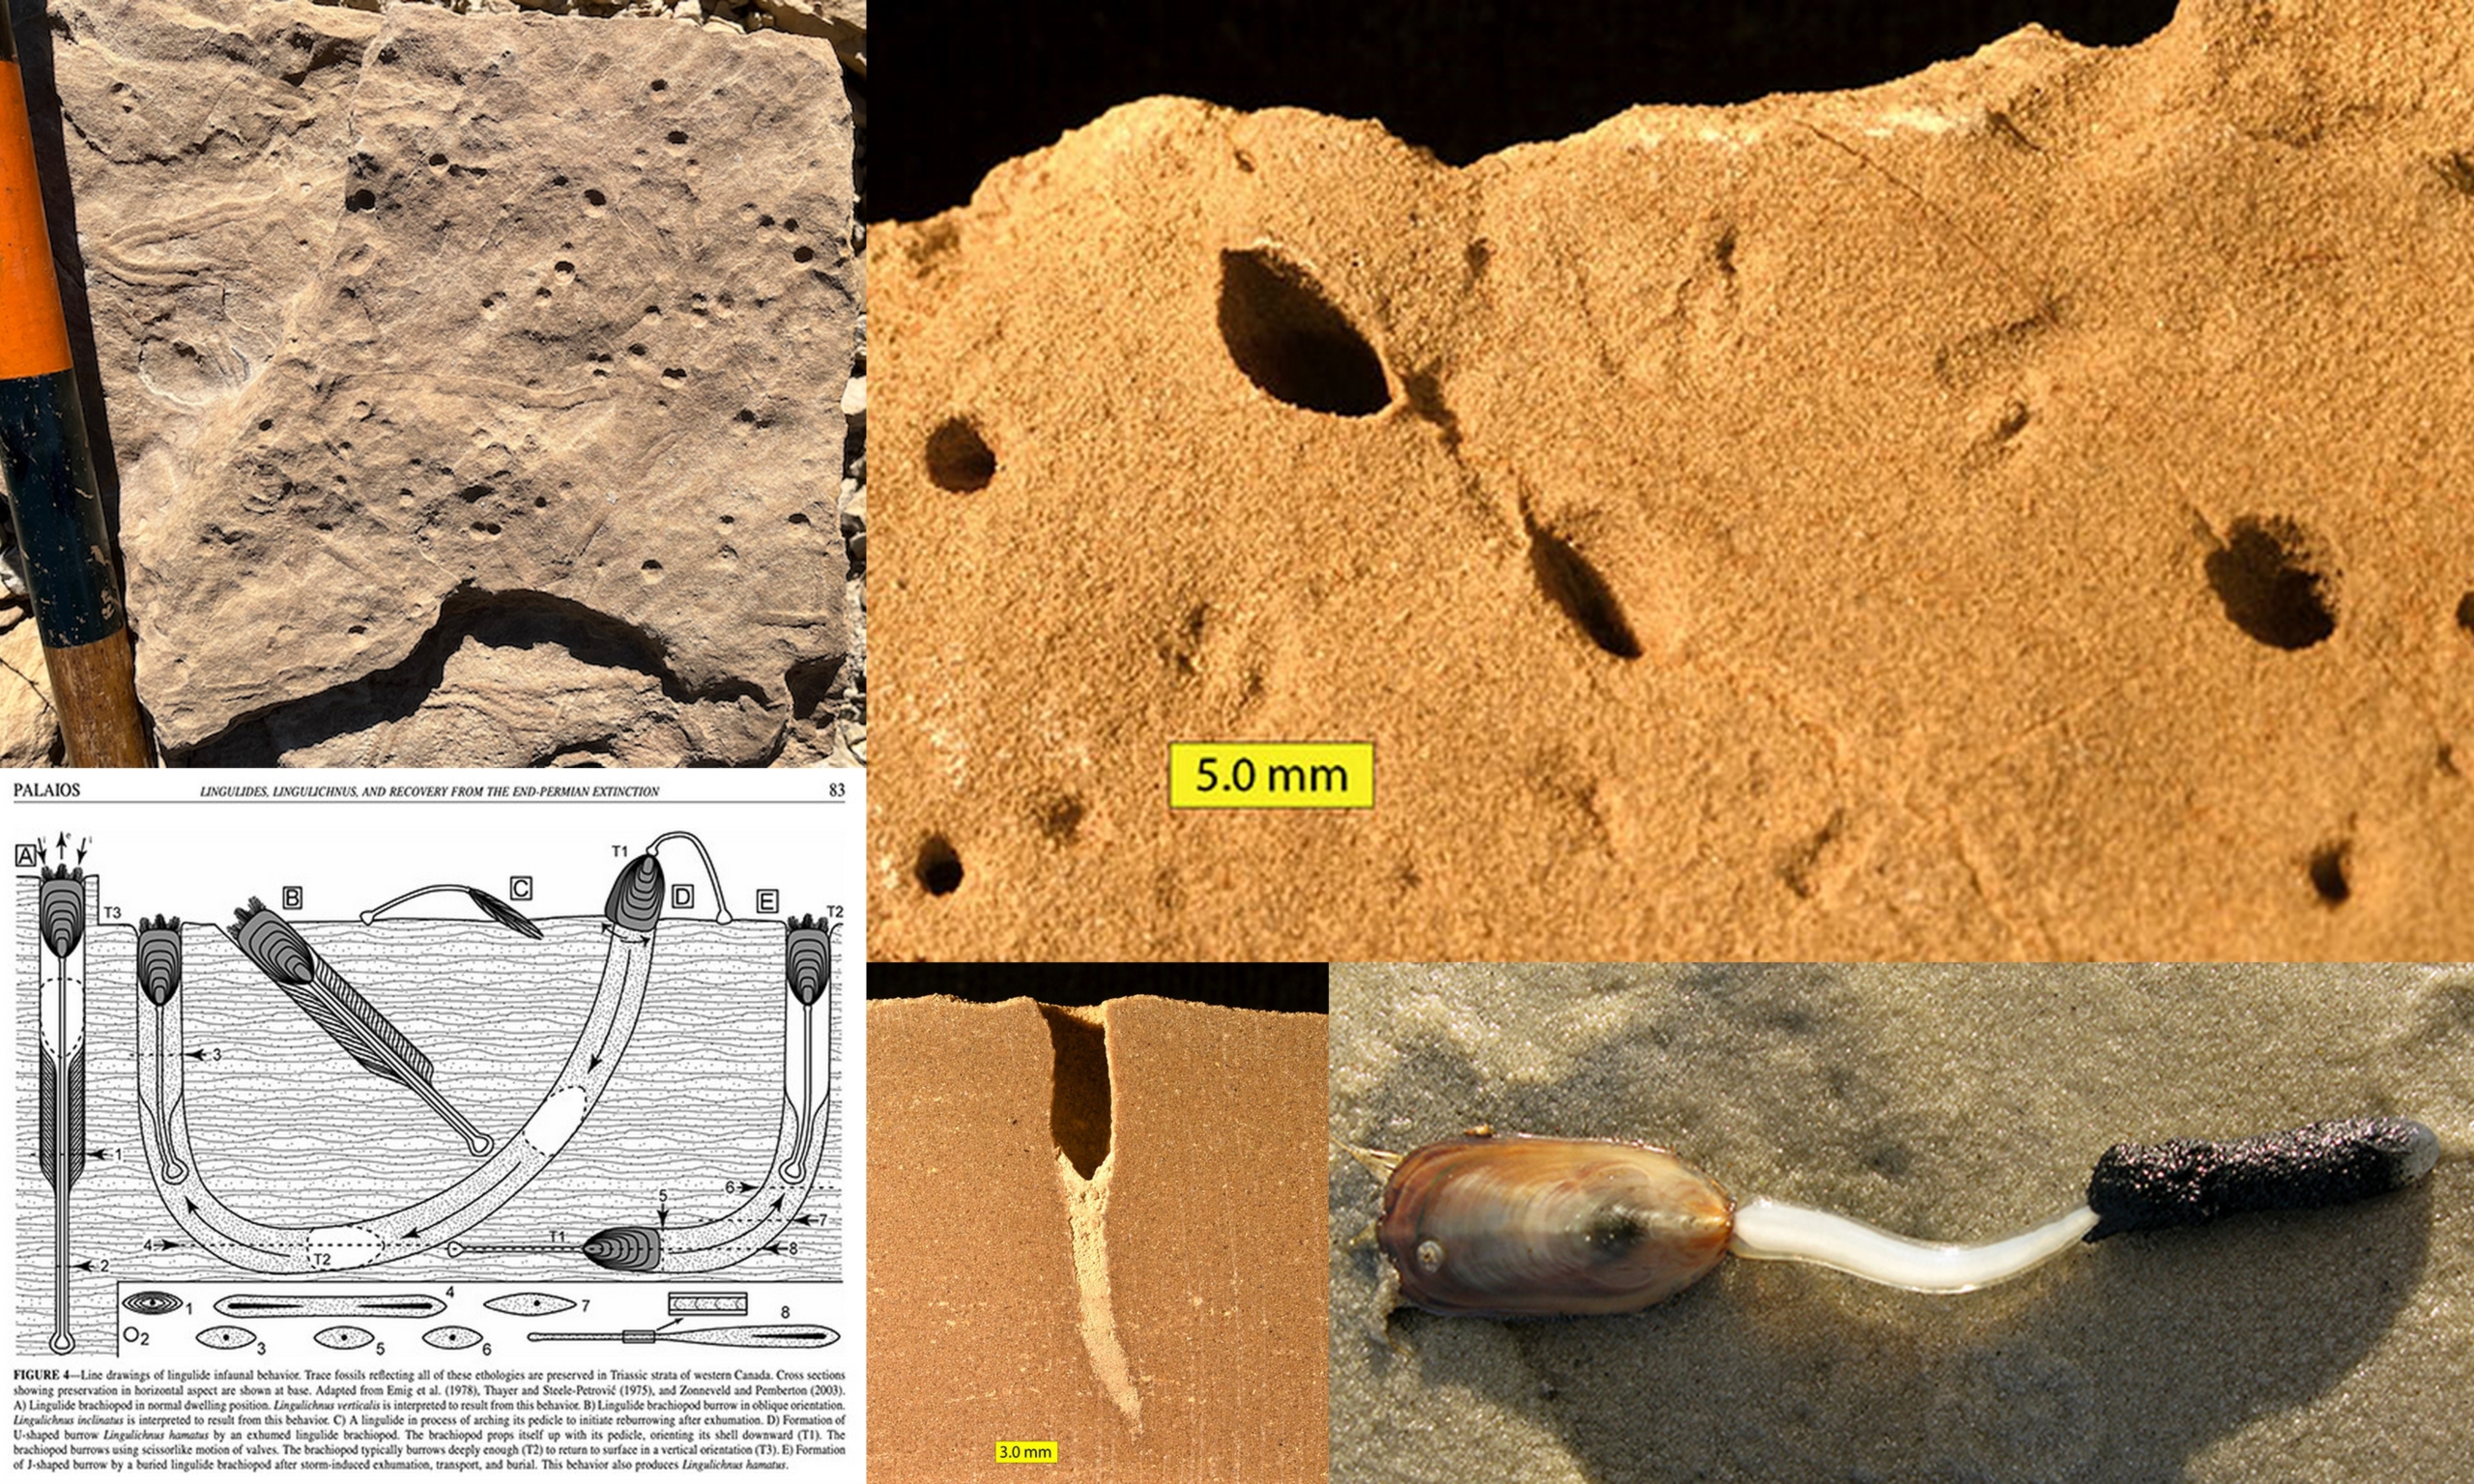
Fossil locality from the Navajo Sandstone in the San Rafael Swell near Colonade arch. Although some have speculated these to be dewatering features (see this paper for abundant examples in the Carmel near Kanab), these more likely appear to be a small grove of trees from an inter-dune oasis. Tee trunk fossil in the Navajo at left center is one of many examples of trees & wood in the Navajo from (Parrish, 2007). The living trees shown (bottom right) are desert species known to have existed in Jurassic Navajo times, Cycads, and Araucaria (monkey trees from Argentina).A few of dozens of images of mammal burrows, root casts and fossils and sand pipes in the Navajo Sandstone near the confluence of HW 191 & 313 near Moab, from Lucas, 2004. therapsid Burrows in the Jurassic Navajo Sandstone. In Odier, ‘The Jurassic, The Mammal Explosion’. Available here. Lingulid brachiopod trace fossils from the Middle Jurassic Carmel Formation of southwestern Utah. The holes in the top two pictures are formed from the pedicle of the brachiopod. See details on the Wooster Geologists Blog. These common features show that the brachiopod shells found in these layers are from living, reproducing communities, not simply some dead heap of shells deposited in flood waters.theropod tracks along the Moab Megatracksite in the Middle Jurassic Entrada Sandstone of eastern UtahFull petrified tree from the Jurassic Morrison Formation just east of Bryce Canyon National Park on the top of the Grand Staircase. Fossilized beetle boreholes in the tree suggest quick burial and fossilization with minimum deformation.In addition to petrified trees and dinosaur bones, the Late Jurassic Morrison Formation has abundant dinosaur footprints (like these on Dinosaur Ridge in Morrison, Colorado), showing that the fossils aren’t just random bones from carcasses in some global flood, but part of a living ecosystem where the dinosaurs were walking, about on shorelines interacting with the same environment they are buried in.Mill Canyon Dinosaur Tracksite, near Moab, Utah in the early Cretaceous Cedar Mountain Formation.
.
Cenozoic Layers Just East of the Grand Canyon
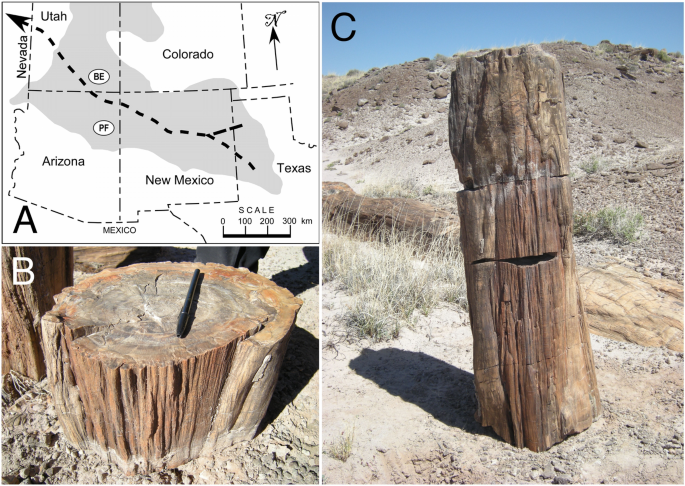
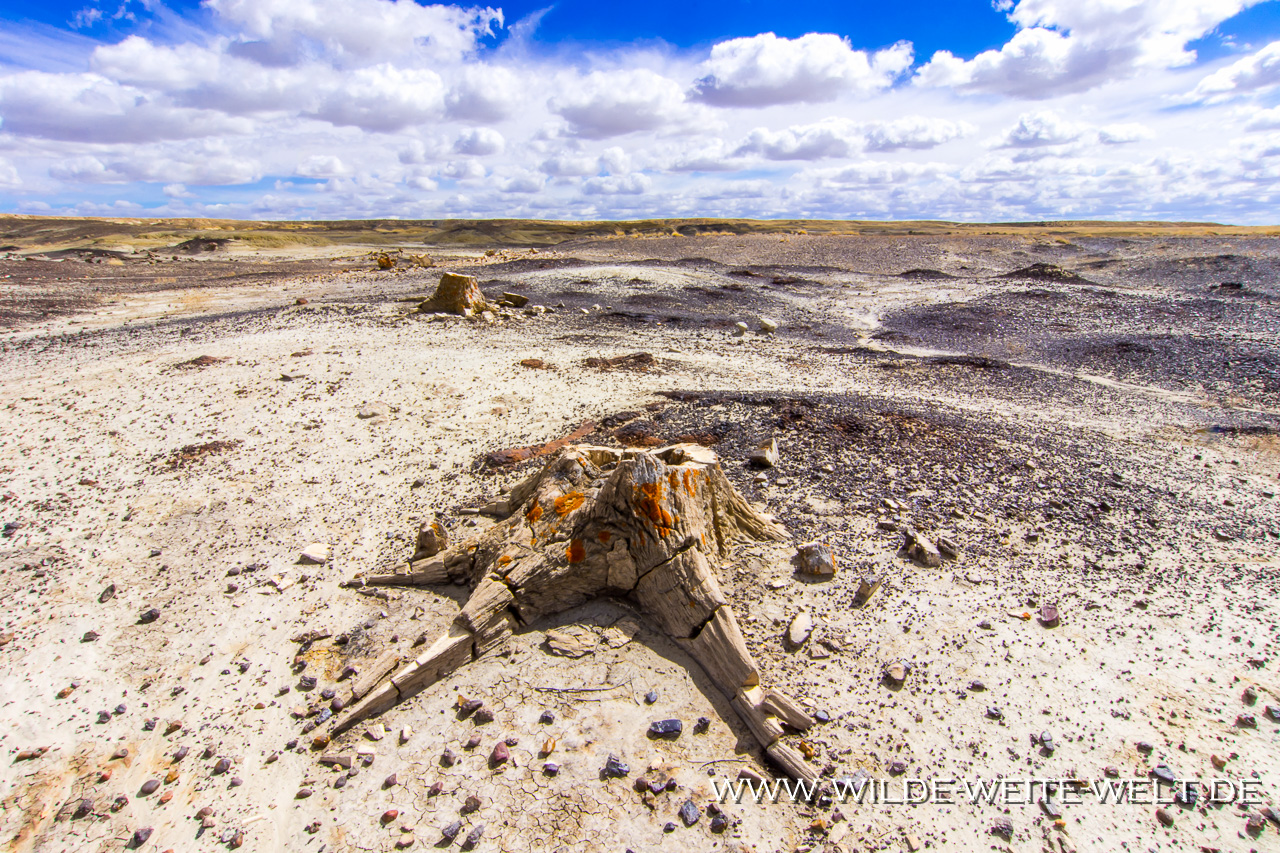
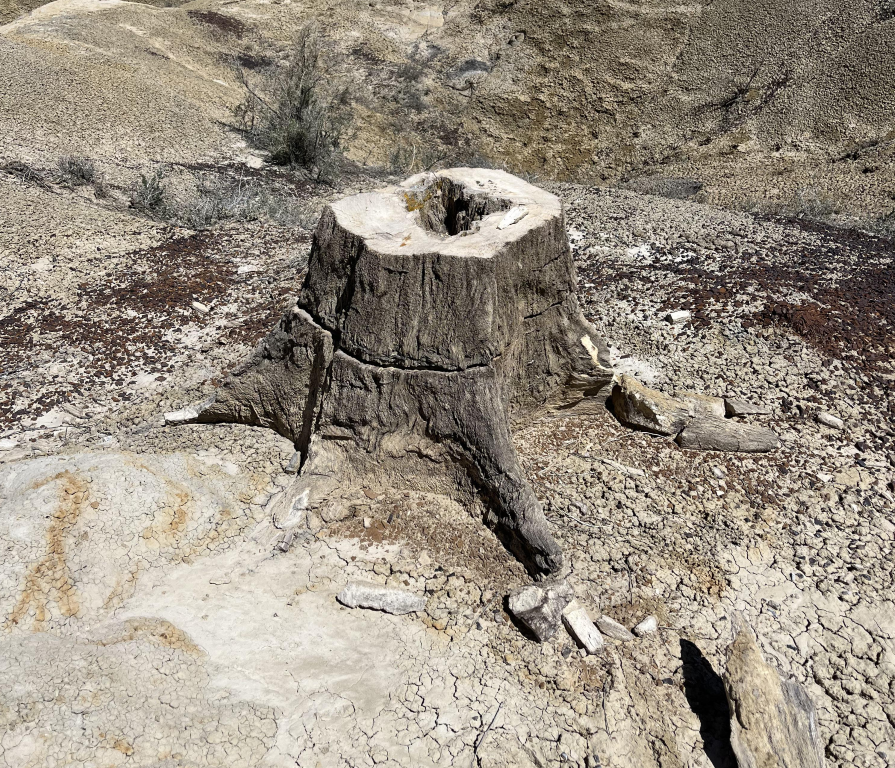
The San Juan Basin, 200 miles east of Grand Canyon, hosts some of the best in situ (in place) petrified logs in the west, dating from 120-55 million years ago. The Fossil Forest member of the Fruitland Formation. Ah-She-Sle-Pah Wash, New Mexico. Great examples can be seen on the phototreknm.com page as well as the AMAZING photographic journey of Peter & Tanja at https://wilde-weite-welt.de
In Situ Petrified tree from the Ah-Shi-Sle-Pah Wilderness, New Mexico (About 200 miles East of the Grand Canyon in the Nacimiento Formation? 65mya, see here)
On the Grand Staircase, by far the best units to find petrified trees (in ancient river systems) are the Triassic Chinle and Jurassic Morrison Formations. Both of these units are easily discernable ancient river systems.
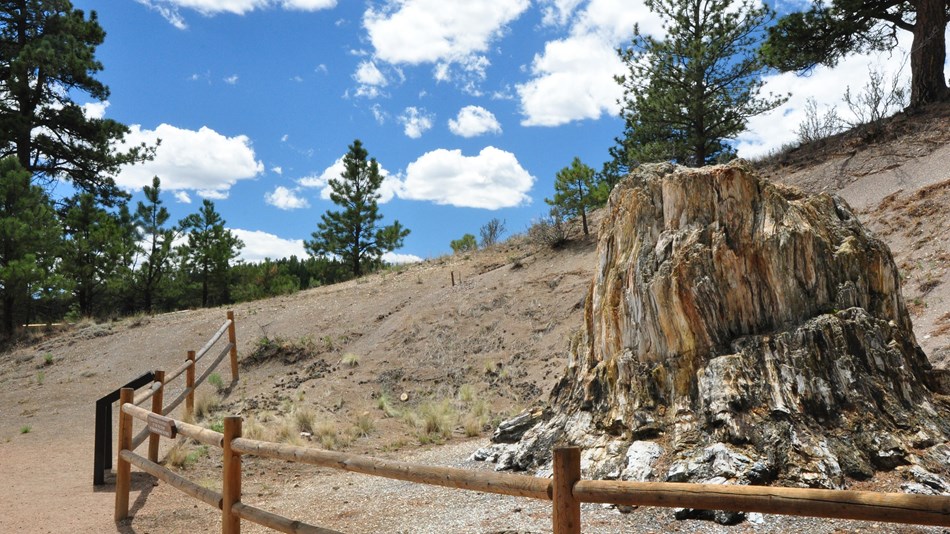
Fossilized ‘in place’ Sequoia stump from Florissant Fossil Beds in Colorado west of Colorado Springs/Pikes Peak dates to 34 million years ago.Lund Petrified Forest, in Washoe County, Western Nevada, contains remains of more than 200 Sequoiastumps and logs buried in Volcanic tuff dating to the Miocene Period. ( A ) 1946 photo of the most prominent stump (photo courtesy of University of Nevada Reno Library Special Collections Department); ( B ) The same site in 2014 showing a protective fence installed by the Bureau of Land Management.
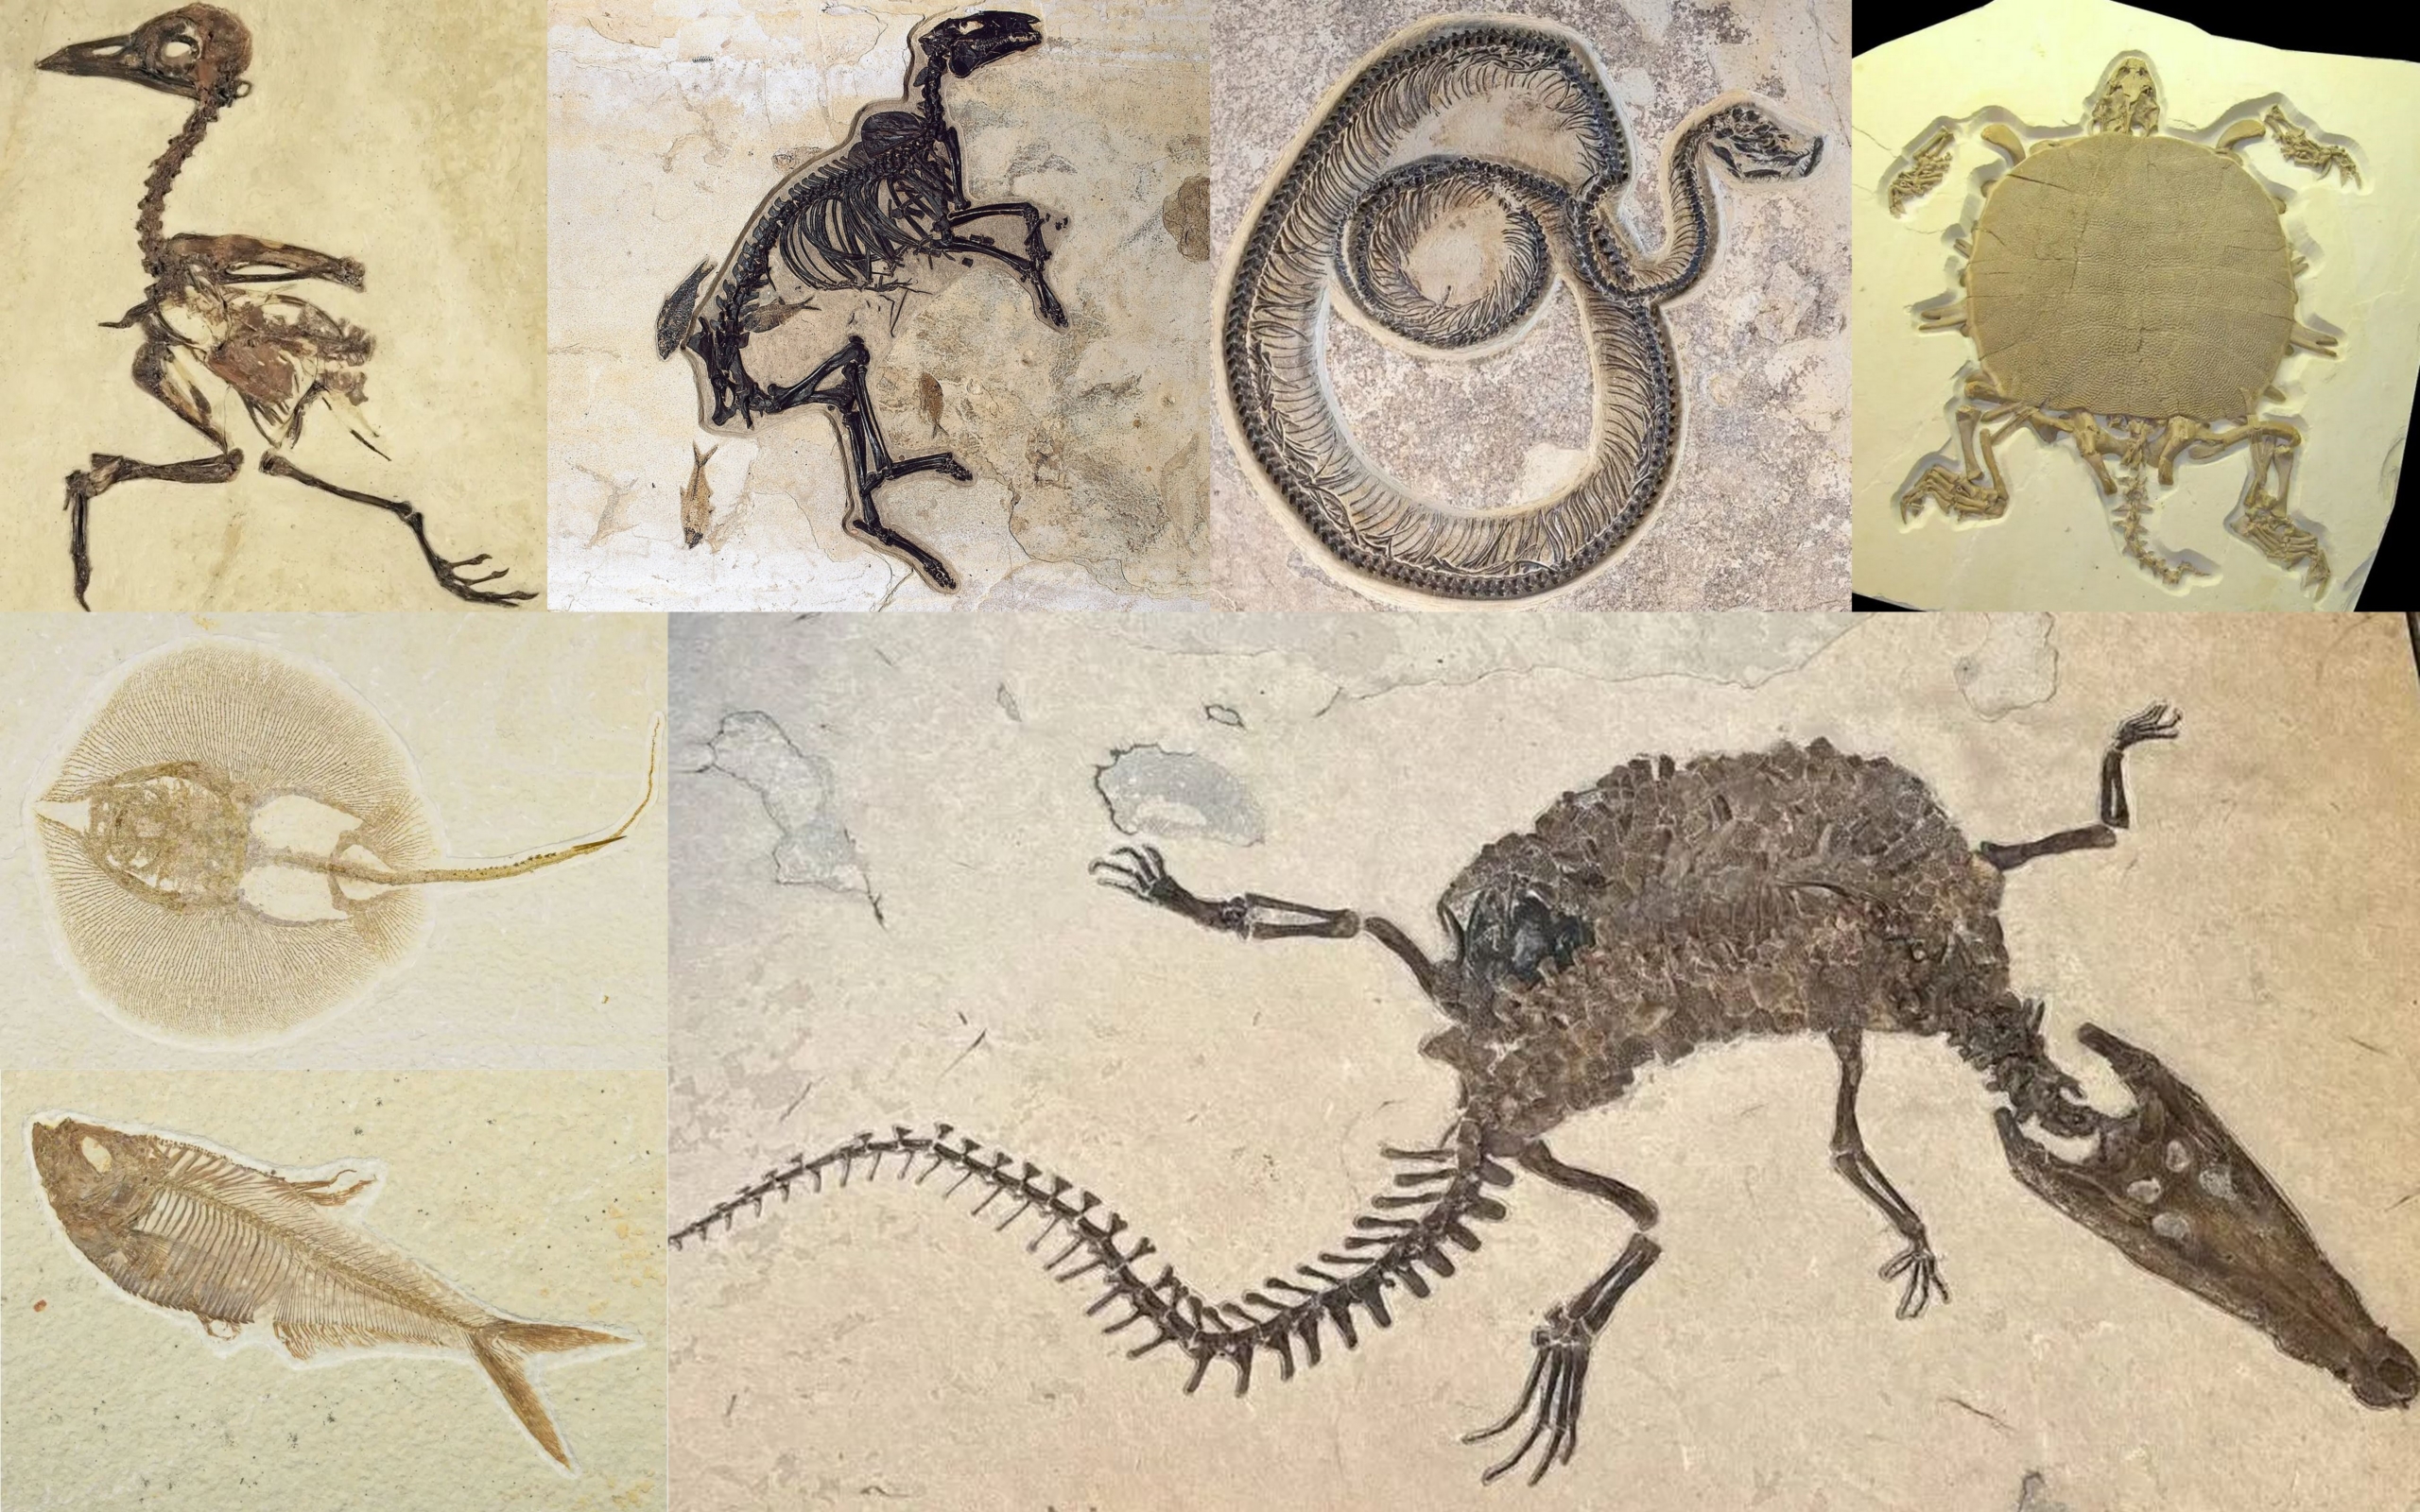
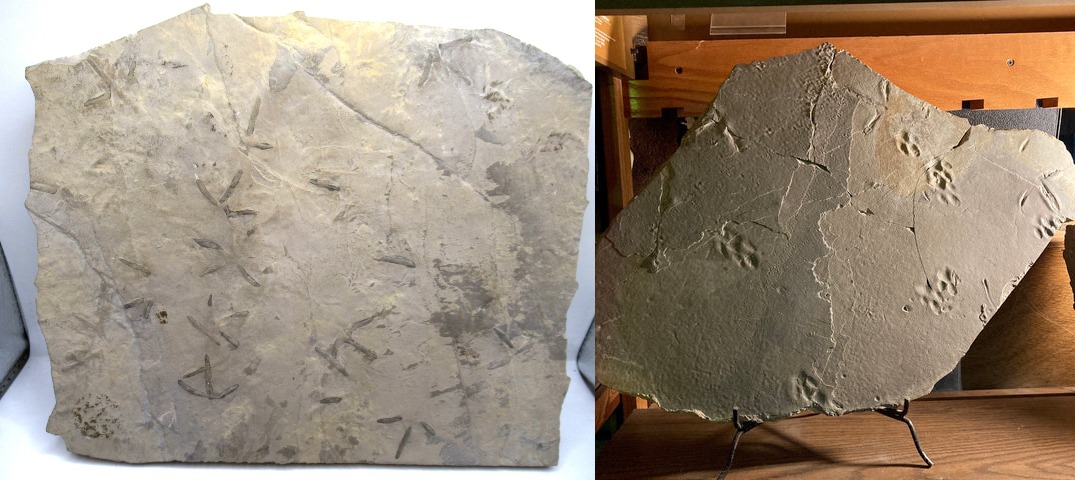
The immense number of fossils found in the Eocene Green River formation might lead some to suppose some type of catastrophic event led to the death and burial of so many animals, but as seen in the next image, numerous trace fossil burrows and trackways prove a fairly uniformitarian habitat existed in this large inland lake. Although it seems likely that the lake somehow became toxic during episodes, perhaps like the Aerial Sea of Asia or Lake Turkana of Africa where massive changes in ph coinciding with large influxes of sediment played a part in their demise.
Fossils of the Eocene Green River Formation of Utah & Wyoming. Equivalent to the Claron Fm. of the Grand Staircase. Animals clockwise from top left are a bird, small horse, snake, turtle, crocodilian, fish and fresh water ray.Bird & mammal tracks in the Green River formation show that animals were walking around on the same lake shores where many dying animals created fossils.
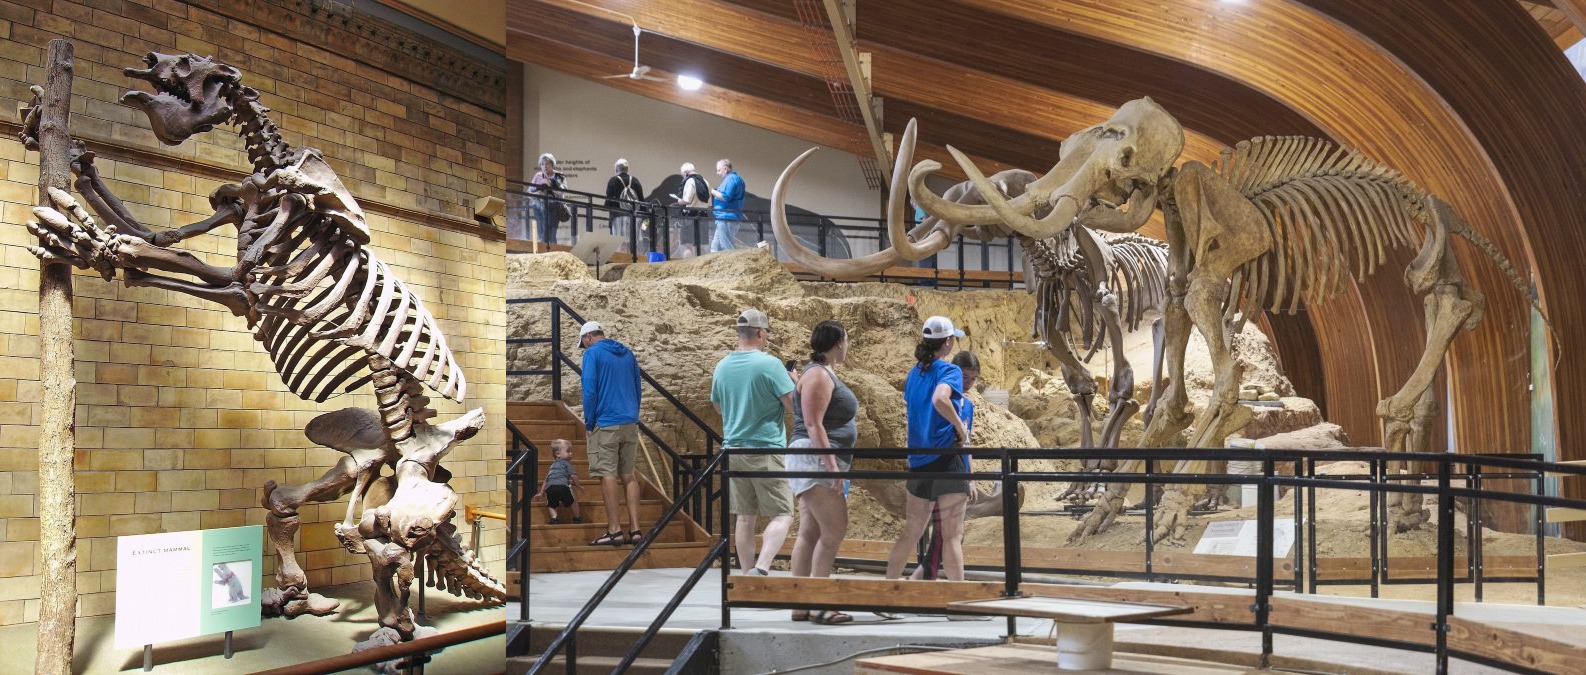
Ice age magafauna such as the Huntington mammoths & groundsloth found on the Wasatch Plateau near Price, Utah during construction of the Huntington damn project. These animals are often found on the top of the stratigraphic column. The Huntington fossils were found in a bog sitting on glacial outwash radiocarbon dated to around 12,000 BP. The outwash sites on top of Paleocene Northhorn Formation, however, many tusks and teeth have been found in Lake Bonneville Shoreline deposits which date from Miocene to Pliestocene in age. Hair and skat has been found in Navajo Sandstone coves in Glen Canyon just up river from the Grand Canyon.
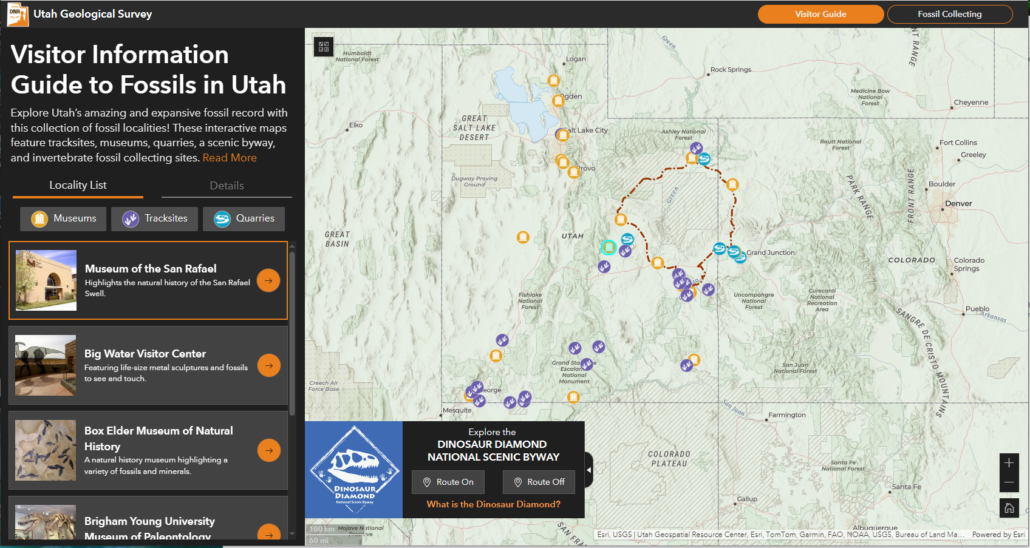
Huntington mammoths & groundsloth found during construction of the Huntington damn project, housed in Price, Utah.Utah Geological Survey Utah Fossil Site & Museum interactive map. (click to open the application)UtahGeology.com North American Fossil Locality Interactive Map. (click to open)
https://utahgeology.com/wp-content/uploads/2025/01/eubrontes_stgeorge_tracksite1200x900.jpg9001200Lance Weaverhttps://utahgeology.com/wp-content/uploads/2025/07/utah-geology-site-logo-420px-new.pngLance Weaver2025-01-07 01:32:592026-03-28 23:22:00Tracks, Traces & Other Fossils of The Grand Canyon & Grand Staircase
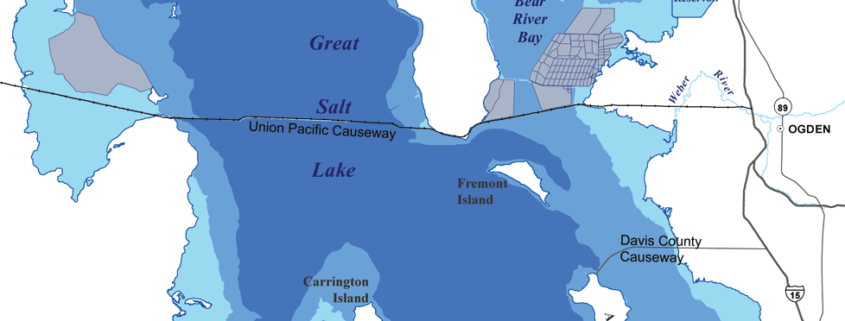
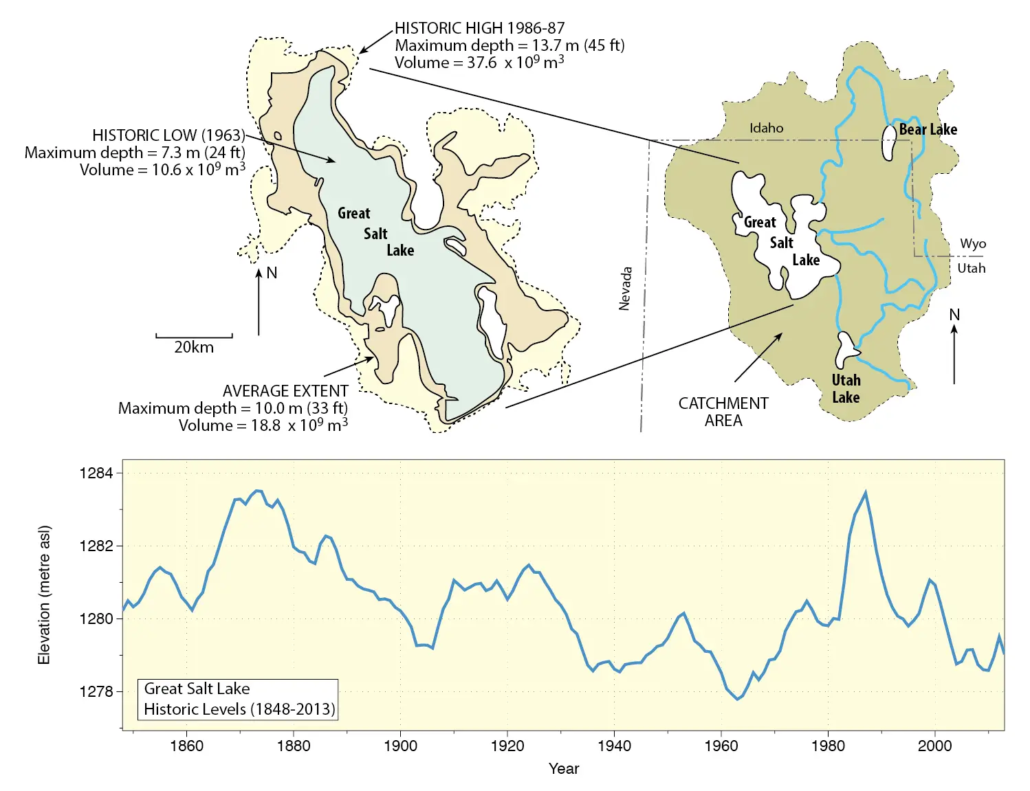
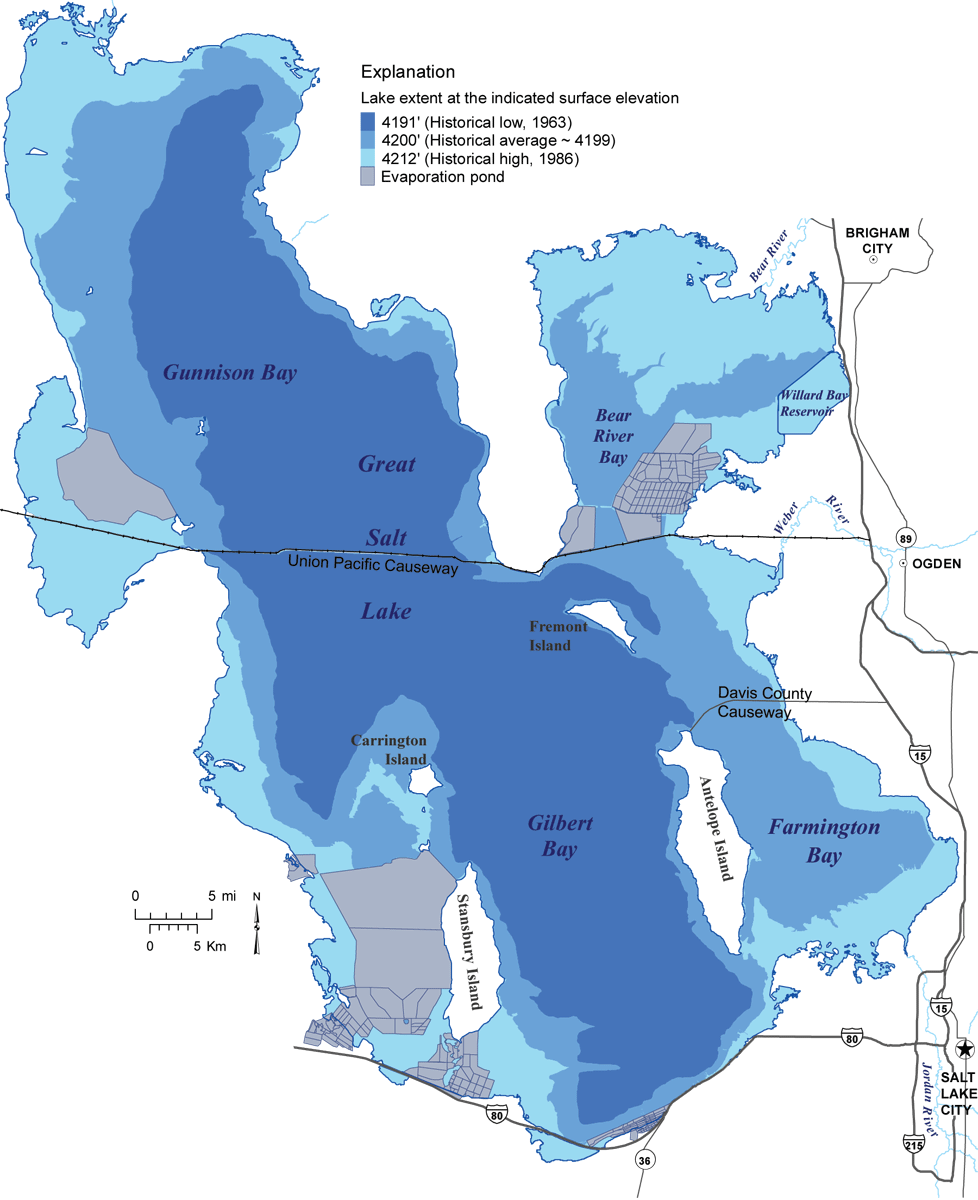
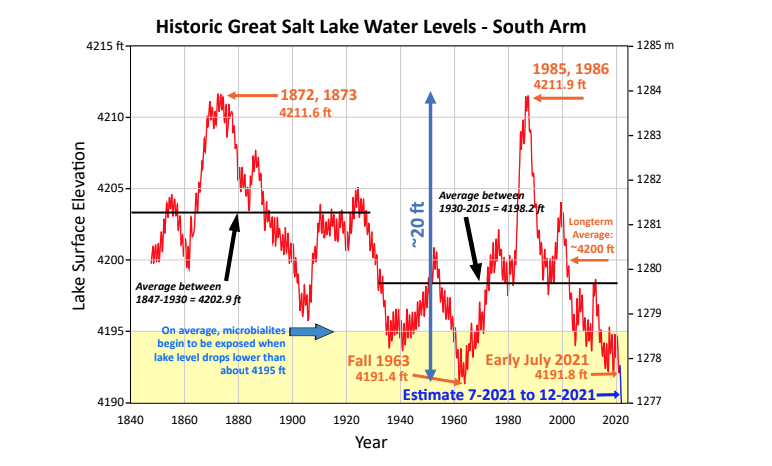
Great Salt Lake, may be the best proxy for determining the water history of the Colorado river. The lake has experienced large changes in volume & water levels over the decades. The upper figure shows the different extent of its highest and lowest levels in historical time. The chart plots yearly changes of lake water level since 1847 when reliable records began.
How They Lie to You
Recently the New York Times did an article on the Great Salt Lake, titled “The Great Salt Lake Is Drying. Can Utah Save It?” In this piece of propaganda disguised as a scientifically based article, they showed a chart of “historic levels of the Great Salt Lake”, which misleadingly started in 1980’s at the lakes historic high-stand and ended in the present levels. The chart, much like the article, purposefully left off any mention of how lake’s levels just a few decades prior to the 1980’s were just as low as those today. It, like much of the media propaganda lately, misleads uninformed readers into thinking climate-change had caused some sort of unprecedented crisis. The same type of dishonest tactics are also often used to promote a false narrative of Colorado River scarcity which obfuscate the true problem of over-allocation and special interest propaganda. (Mostly from international privatized irrigation conglomerates in California & Arizona, spreading disinformation under shell companies cloaked as environmental groups).
Later in this article we’ll detail some of these International and US big money conglomerates and how they manipulate the narrative to make more money at the expense of ignorant political servants or the unwitting public.
Great Salt Lake Background
The Great Salt Lake, located in the northern part of the U.S. state of Utah, is the largest saltwater lake in the Western Hemisphere and the eighth-largest terminal lake in the world. As a terminal lake, it has no outlet; water leaves only through evaporation, leaving behind concentrated minerals and salts. It is a remnant of the prehistoric Lake Bonneville, which at its peak covered roughly 20,000 square miles of western Utah and reached depths of 1,000 feet.
Today, the statistics of the lake are as fluid as its shoreline. While its average surface area is approximately 1,700 square miles, this figure can vary by thousands of miles depending on the water level. The lake is remarkably shallow, with an average depth of only about 14 to 15 feet. Its salinity ranges from nearly fresh at the river inlets to roughly 27% in the North Arm—nearly nine times the salinity of the world’s oceans.
Historical Hydrology and the 1960s Baseline
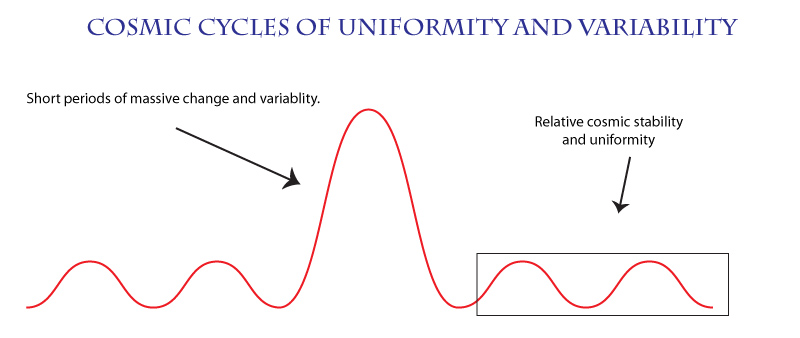
The history of the Great Salt Lake is defined not by stability, but by dramatic, oscillating cycles. Since formal record-keeping began in the mid-19th century, the lake has been a barometer for the climate of the Intermountain West. Contrary to modern narratives that suggest a linear decline, the historical data shows a series of “low-water” events followed by massive recoveries.
In the mid-1860s, early settlers and explorers noted significantly low levels as the region experienced a period of prolonged aridity. By the early 1900s, specifically around 1905, the lake again dipped to concerning levels that prompted local discussions about the lake’s potential disappearance. However, the most significant historical benchmark occurred in the 1960s. In 1963, the Great Salt Lake reached what was then its lowest recorded level in history, dropping to an elevation of approximately 4,191.35 feet above sea level.
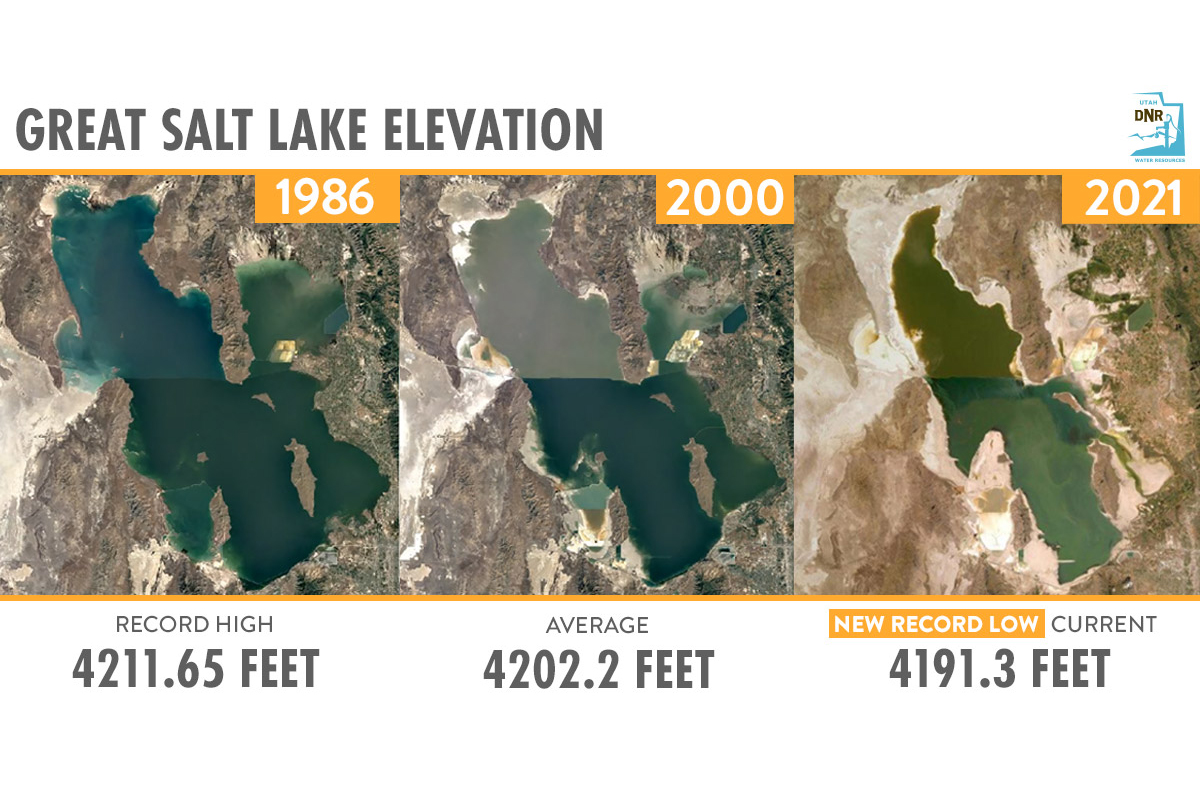
At that time, much like today, there were fears that the lake was in a terminal state of recession. Yet, only twenty years later, the cycle reversed with unprecedented ferocity. By the mid-1980s, the lake rose so rapidly and so high (reaching 4,211.6 feet in 1986 and 1987) that it caused hundreds of millions of dollars in damage to infrastructure, railways, and interstate highways, necessitating the construction of the multi-million dollar “West Desert Pumping Project” to move excess water out of the basin.
Sensationalism vs. Historical Fluctuations
In recent years, the Great Salt Lake has again reached levels that match or slightly exceed the lows of 1963. While this is a significant hydrological event, the framing of these levels by modern media outlets and environmental organizations often borders on the sensational. By focusing exclusively on a 20- or 30-year window, these outlets frequently present current conditions as “unprecedented” or a “looming collapse” that has never occurred before.
This narrative often ignores or deliberately obscures the fact that the lake has reached these exact depths multiple times in the last 160 years. When organizations with specific political or environmental agendas present the current low levels as a permanent “new normal” caused by irreversible factors, they overlook the demonstrated historical resilience of the basin. The history of the lake proves that “record lows” are not the end of the story, but rather a recurring phase in a long-term hydrographic cycle. By creating a culture of fear, these groups often attempt to bypass nuanced discussions about water management in favor of radical policy shifts, hiding the reality that the lake has always recovered from these cycles in the past.
The Great Salt Lake as a Colorado River Proxy
The Great Salt Lake serves as one of the most reliable and carefully measured proxies for determining the historical and future flows of the Colorado River. Because both the Great Salt Lake Basin and the Upper Colorado River Basin rely on the same primary water source—the winter snowpack of the Rocky Mountains—their hydrological fates are intrinsically linked.
For decades, the same organizations that sensationalize the levels of the Great Salt Lake have applied the same tactics to the Colorado River. The public is often told that the Colorado River is in a state of terminal decline and that reservoirs like Lake Mead and Lake Powell will never again reach capacity. The narrative suggests that the “megadrought” is a permanent shift in the planetary climate that renders historical data irrelevant.
However, the Great Salt Lake suggests otherwise. The lake’s long-term data provides a clear record: periods of extreme low flow and low lake levels are inevitably followed by periods of high precipitation and rapid recovery. If the Great Salt Lake could transition from the “all-time record low” of 1963 to the “all-time record high” of 1987 in just over two decades, it demonstrates that the Intermountain West’s water systems are characterized by high-amplitude volatility, not linear exhaustion.
The Great Salt Lake stands as a physical rebuttal to the claim that current low levels in the Western water systems are unprecedented or final. Just as the lake “disappeared” in the 1860s, 1905, and 1963 only to return with a vengeance, the hydrological history of the region suggests that the Colorado River flows will eventually follow the same path of recovery. The lake is a reminder that in the West, the only constant is change, and the most dangerous mistake a researcher can make is to mistake a cyclical low for a terminal end.
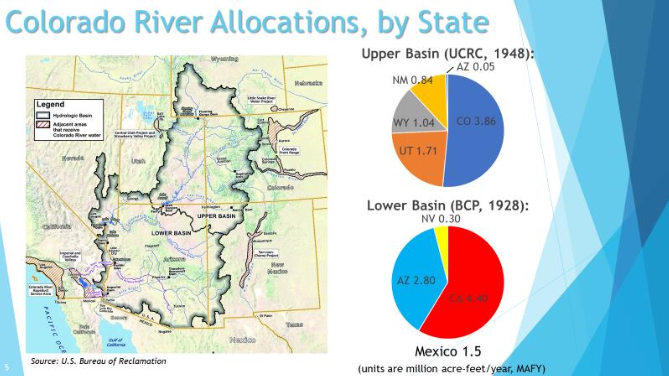
How Utah is Getting Screwed Out of Its Colorado River Allocation
Despite the cyclical resilience of the region, Utah is currently allowing itself to be cheated out of its rightful annual allocation of the Colorado River. This systemic loss is driven by a fundamental failure in water accounting: the state fails to properly calculate and credit the “return flows” of water used in its diversions. In the rigid accounting of the Colorado River Compact, Utah is often charged for the total volume of water diverted, rather than the “consumptive use” which represents water actually lost to the system. This ignores the reality that a significant percentage of water used for irrigation or municipal purposes eventually returns to the river system via surface runoff and groundwater recharge, effectively subsidizing the lower basin states at Utah’s expense.
The physical data supports the conclusion that Utah’s actual footprint on the river is far smaller than administrative figures suggest. According to a 2024 study published in Nature (“A database of all major water diversions in the Upper Colorado River Basin“), there are 1,358 major water diversions in the upper river system. Of these, Utah accounts for only 101—the vast majority of which are concentrated on reservation lands in the Uinta Basin. It is hydrologically improbable that these few, localized diversions are permanently removing the massive volumes of water currently calculated in the state’s usage reports. The state is being held to a standard of “permanent withdrawal” that fails to account for the cyclical return of that water to the downstream flow.
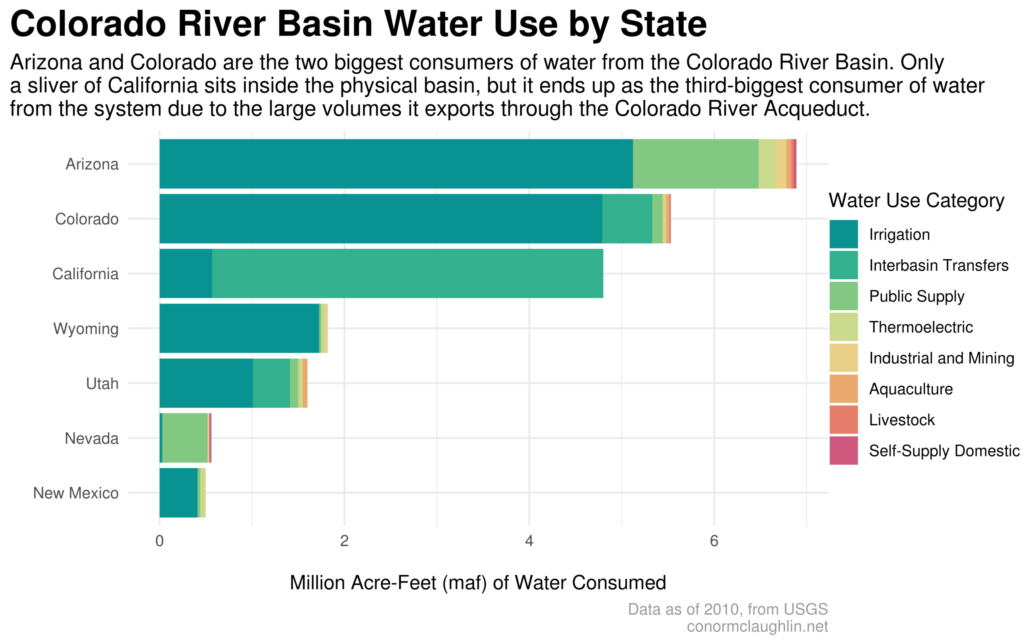
Furthermore, a comparison of irrigated agricultural land across the basin states reveals a stark imbalance between supposed usage and actual land footprint. While California and Arizona manage millions of acres of intensive, year-round agriculture within the basin, Utah’s irrigated acreage in the Colorado River basin is a mere fraction of that scale. The stats simply do not add up: Utah is credited with using a disproportionate amount of its allocation despite having significantly fewer diversions and less irrigated land than its neighbors. By accepting these flawed metrics, Utah is forfeiting its water security to feed a narrative of scarcity that ignores the basic mathematics of its own land use and hydrological return.
Water for Hire: A Summary of Big Money Interests in Colorado River Water
Several private equity, hedge fund-style, and agribusiness investment/capital groups (or their backed entities) own or control large portfolios of irrigated agricultural land—and thus the attached Colorado River water rights—in Arizona and California. These are often structured as conglomerates of LLCs/subsidiaries holding farmland in key districts like the Imperial Irrigation District (IID, CA), Palo Verde Irrigation District, Wellton-Mohawk, Cibola Valley, or Yuma-area projects. Water rights are typically “appurtenant” to the land (senior or priority rights under the 1922 Compact, Boulder Canyon Project Act, and Arizona v. California Supreme Court decree), used for large-scale crop irrigation (alfalfa, vegetables, etc.).
These groups are not traditional “irrigation companies” (e.g., mutual water companies or public districts that deliver water via canals), but they effectively control major blocks of irrigation water through land ownership, leasing to farmers, or fallowing for transfers. They act as major stakeholders in Colorado River issues, influencing or participating in water markets, transfers (ag-to-urban), conservation deals, and related litigation/policy fights over allocations, shortages, and post-2026 guidelines. Big ag users (including these holdings) dominate ~70-80% of lower basin use and feature prominently in state/tribal/federal negotiations and lawsuits (e.g., over transfers, environmental reviews, or priority rights).
Here are the most relevant examples, focusing on public/private status and international ties where applicable:
US-Based but with International Backing or Reach
Greenstone Resource Partners LLC (private water investment firm, Phoenix/NY ties): Owns or controls thousands of acres via ~25 subsidiaries/affiliates (e.g., GSC Farm LLC, Sunstone Farms LLC) in Arizona, especially La Paz County (Cibola area, directly on the Colorado River) and Yuma County (Wellton-Mohawk Irrigation & Drainage District). Key holdings include ~485 acres in Cibola with ~2,033 acre-feet (AF) of 4th-priority Colorado River water (transferred in a high-profile 2018 deal to Queen Creek, AZ suburb for urban use, yielding ~$14M profit after purchase). They lease land for irrigated farming (alfalfa/cotton) or fallow it for transfers and have board influence in districts like Cibola Valley Irrigation & Drainage District. Backers/ownership: Backed by MassMutual (Massachusetts Mutual Life Insurance, a large US mutual financial conglomerate—privately held by policyholders but with massive capital operations) and its Barings subsidiary; also public pension funds and financing from Rabo AgriFinance (Dutch multinational Rabobank subsidiary—international banking/finance capital). Litigation/stakeholder role: Directly involved—counties (La Paz, Mohave, Yuma) sued the Bureau of Reclamation over the Cibola-Queen Creek transfer’s environmental review; a federal judge ruled it inadequate in ~2024, highlighting precedent risks for more transfers. This makes them a flashpoint in broader ag-to-urban water litigation and policy debates.
Water Asset Management LLC (WAM) (private NY-based hedge fund/investment firm focused on water assets): Owns 6,000+ acres (via LLCs) in Arizona (Maricopa, Mohave, Yuma, and a major ~12,793-acre/ $100M+ purchase in La Paz County’s McMullen Valley) plus holdings in California’s Imperial Valley (leased/farmed for vegetables/row crops). Some Mohave/Yuma parcels have direct Colorado River allocations. They buy irrigated farmland portfolios, lease to operators (e.g., ties to Elmore family farms in Imperial), and position for water market plays/transfers. Ownership: Private capital group (co-founded by Disque Deane Jr.; former Vidler ties). Investors include institutional funds. Stakeholder role: Advocates for market-based solutions in water-scarce West; part of the investor wave affecting basin-wide negotiations, conservation programs (e.g., IID/System Conservation), and litigation risks over rights transfers.
Vidler Water Company / Vidler Water Resources (water resource developer): Owns ~2,400+ acres of ag land/water rights in Arizona (La Paz/Maricopa) plus assets in California and other Western states. Focuses on acquiring ag water rights and converting to higher-value municipal/industrial use (including Colorado River-related storage/transfers in AZ). Ownership: Formerly public (Vidler Water Resources, Inc.); acquired in 2022 by D.R. Horton, Inc. (NYSE: DHI, major US publicly held homebuilder—public capital group). Now operates as Horton’s water arm. Stakeholder role: Pioneer in Western water markets; holdings contribute to the private investor presence in Colorado River ag water debates.
Renewable Resources Group (RRG, aka ReNu or related LLCs like Alphabet Farms/Imperial Farming) (private LA-based investment/developer of water, energy, and farming projects): Controls ~16,000 acres in California’s Imperial Valley—one of the largest private ag landholders there—with associated Colorado River water rights (via IID; Imperial gets ~3.1M AF total, mostly ag). Operates irrigated farms producing alfalfa, vegetables, dates, etc. Previously partnered on Palo Verde Valley (CA) deals involving Colorado River rights. Ownership/backers: Private capital group (founded by Cole Frates/Ari Swiller); partnered with Harvard University endowment (major institutional capital investor) on deals like a 13,000-acre Palo Verde purchase (later sold profitably to Metropolitan Water District). RRG execs serve on Colorado River Board of California. Stakeholder role: Large private user/holder in the basin’s biggest ag water user (Imperial); involved in water trading attempts and policy (e.g., fallowing/transfers).
International Companies (Direct Agribusiness Owners)
These are international (non-US headquartered) public or corporate entities that own/operate their own large-scale irrigated farming operations (effectively irrigation conglomerates) with Colorado River water rights in AZ/CA:
Almarai Company (Saudi Arabia-based, publicly listed on Tadawul Saudi exchange—publicly held international capital/agribusiness group): Via subsidiary Fondomonte, owns ~10,000 acres in Arizona + ~3,500 acres in California’s Palo Verde Valley (direct Colorado River water for alfalfa irrigation, exported as hay for Saudi dairy). Major water user; operations have faced scrutiny/lease terminations over groundwater but retain private land/Colorado River rights in CA.
Al Dahra ACX Global Inc. (UAE-based international agribusiness conglomerate): Operates large forage/alfalfa farms in Arizona (La Paz, etc.) and California, using Colorado River or connected water sources. Exports hay; one of the bigger foreign players in Southwest irrigated ag.
These entities (especially the US investment firms) have amassed holdings amid drought-driven water scarcity, enabling profits via land/water value appreciation or transfers. They are “major stakeholders” in the sense that their activities fuel debates, market pressures, and indirect involvement in litigation (e.g., challenges to transfers, environmental impacts, or basin allocation fights between lower basin states, feds, tribes, and ag/urban users). True private “irrigation companies” (canal operators) are rare today—most rights shifted to public districts like IID decades ago—but these groups control equivalent scale through land ownership.
Direct evidence of large-scale donations to media campaigns or formal partnerships with major environmental NGOs (e.g., Nature Conservancy, EDF, American Rivers) is limited or absent in public sources. Instead, they engage in targeted influence, public positioning as “solutions providers,” and policy advocacy that critics view as creating conflicts of interest (profiting from scarcity-driven transfers/fallowing while framing it as conservation/public good).
.
Greenstone Resource Partners (and subsidiaries like GSC Farm/Sunstone Farms)
Lobbying/government influence via local control: Greenstone’s managing director Mike Malano was elected to the board of the Cibola Valley Irrigation & Drainage District (CVIDD). Landowner voting (2 votes per acre owned) gave them outsized sway in a small rural district. Under their influence, CVIDD amended its federal contract (post-1992) and internal rules (2006–2014) to ease “water exchange, lease, or transfer” approvals without full member votes—setting the stage for their landmark 2018 sale of ~2,033 acre-feet of Colorado River water from ~485 acres in Cibola, AZ, to Queen Creek suburb (Phoenix area) for ~$24M (after buying for ~$9.8M). A district board president leasing from Greenstone publicly supported the transfer in 2019 testimony. This “long-term plan” (per local attorney) enabled the first private brokerage of mainstem Colorado River rights, now under federal court scrutiny for inadequate NEPA environmental review (judge ruled against Bureau of Reclamation approval in 2024; counties sued arguing precedent risks).
Public positioning/media: Website and exec statements frame Greenstone as “a water company” advancing “transactions that benefit both the public good and private enterprise” and “reliable, sustainable water supplies.” At a 2022 Arizona legislative hearing, Malano described it as “one of the largest farming operations in the state” (downplaying its hedge-fund-style backing by MassMutual/Barings/pension funds). Critics (e.g., La Paz County supervisors) called this “infiltration” of rural towns, comparing it to the Owens Valley grab and warning of rural decline/farm fallowing.
Perceived conflict of interest: The deal is criticized as greenwashing profit (urban supply) at rural/env expense during drought—opening “Pandora’s box” for more transfers while bypassing broader basin negotiations. Env/farm advocates and counties opposed it as prioritizing Wall Street over communities/river health.
Water Asset Management (WAM)
Public advocacy for policy reform (market-based lobbying): WAM execs (e.g., legal counsel James Eklund, ex-Colorado water negotiator; co-founder Matthew Diserio) have been vocal in national media (NYT 2021, SLTrib/ProPublica) pushing Colorado River “reform”: commodify water for trading, create private incentives/accounts in reservoirs (e.g., Lake Powell credits from fallowing), and attract private investment/innovation for conservation amid climate-driven shortages. Diserio called U.S. water “the biggest emerging market on Earth” and a “trillion-dollar opportunity.” WAM has done rotational fallowing in AZ to generate credits sold to urban/Lake Mead accounts.
Ties to legislation: In 2024–2026, WAM’s ~$100M purchase of 12,793 acres in rural La Paz County’s McMullen Valley (alfalfa land) aligns with a proposed Arizona bill (early 2026) expanding rural-to-urban transfers. WAM argues it “saves more water” than current use; Arizona AG has considered suing to block on public nuisance grounds (overpumping/groundwater impacts). This builds on their broader AZ/CA/CO holdings (6,000+ acres) positioned for market plays.
Public sway: Statements emphasize public-private collaboration to address drought/climate (vs. “use it or lose it” waste).
Conflicts/env response: American Rivers, farm advocates, and water managers rebutted WAM’s 2021 comments as threatening collaborative basin management, agriculture, and ecosystems—favoring speculation over public solutions. Critics see COI in advocating markets that let them profit from scarcity they help monetize (buy low on distressed ag land, sell high to cities).
Vidler Water Resources (acquired by public homebuilder D.R. Horton in 2022)
Direct lobbying: Retained Veridus lobbying firm (Arizona). CEO Dorothy Timian-Palmer directly lobbied Central Arizona Groundwater Replenishment District (CAGRD) board/chair in 2018 against a competing $97.5M deal with Gila River Indian Community—arguing Vidler’s stored Colorado River credits (Harquahala/Phoenix areas) were better/cheaper, via calls/emails framing it as “negotiations.” Vidler positioned shortages/drought as “market catalysts” in SEC filings and pitched to state entities (e.g., sold credits to Arizona Water Banking Authority, Scottsdale). They built recharge facilities storing 250,000+ acre-feet, leveraging discounted excess river water rules.
Public positioning: Emphasized “keeping water in Arizona,” jobs/taxes, and helping development amid growth/shortages.
Conflicts: No env ties noted. COI perception: Profiting from banking/transferring public river water (invested ~$100M) while competing against tribal/public alternatives, potentially delaying broader conservation.
Renewable Resources Group (RRG)
Limited public examples: One exec (COO Nicole Neeman Brady) serves on the Colorado River Board of California (state advisory body on river management/negotiations; noted as personal capacity). RRG (with Harvard endowment ties) has done large ag-land deals in Imperial Valley/Palo Verde (Colorado River rights via IID) and previously sold Palo Verde acreage profitably to Metropolitan Water District for urban use. They launched a “Sustainable Water Impact Fund” (and follow-on) framing investments as water sustainability/impact—positioning for conservation-minded capital.
Operational influence via board role and market deals.
International players (e.g., Almarai/Fondomonte, Al Dahra)
No evidence of proactive U.S. lobbying or media campaigns for their AZ/CA irrigated holdings. Instead, they face pushback: Arizona AG sued Fondomonte (Almarai subsidiary) in 2024–2026 for “excessive” groundwater pumping as public nuisance (drying wells, sinking ground in La Paz County); state terminated some leases. Focus has been defensive/operational rather than sway efforts.
Overall patterns and COI notes: These firms rarely disclose formal federal/state lobbying spends (private entities; Vidler used hired firms pre-acquisition). Influence is often indirect (local boards, public comments, media quotes) or via proposed legislation benefiting transfers. They sway opinion by branding as efficiency/conservation innovators solving drought (websites, exec interviews)—a framing env groups frequently reject as speculative profiteering that undermines equitable/public solutions and exacerbates rural declines. No major donations to env groups or overt “green” partnerships surfaced (unlike some broader water-market funds by TNC). Critics argue inherent COI: they buy distressed water rights cheap, fallow/transfer for big gains (~$14M+ profits cited), and advocate rules enabling more of the same, while rural communities and basin-wide env priorities bear costs.
Comparative Water Use and Land Footprint
The following table illustrates the disparity between water contribution, administrative withdrawal figures, and the actual agricultural land footprint within the Colorado River Basin.
State
Water Allotment (AF/yr)
Water Contribution (AF/yr)
% of Total
Total Withdrawal (AF/yr)
% of Total
Agricultural Use (AF/yr)
% of Total
Irrigated Acreage
% of Total
Colorado
3,881,250
9,100,000
76.0%
2,500,000
20.0%
2,250,000
21.6%
1,500,000
37.2%
Utah
1,725,000
1,400,000
11.7%
1,000,000
8.0%
850,000
8.2%
300,000
7.4%
Wyoming
1,050,000
548,000
4.6%
1,043,000
8.3%
1,043,000
10.0%
300,000
7.4%
New Mexico
843,750
400,000
3.3%
450,000
3.6%
350,000
3.4%
130,000
3.2%
California
4,400,000
0
0.0%
4,400,000
35.2%
3,800,000
36.5%
900,000
22.3%
Arizona
2,850,000
500,000
4.2%
2,800,000
22.4%
2,100,000
20.2%
900,000
22.3%
Nevada
300,000
25,000
0.2%
300,000
2.4%
15,000
0.1%
5,000
0.1%
TOTAL
15,050,000
11,973,000
100%
12,493,000
100%
10,408,000
100%
4,035,000
100%
Data represents generalized annual averages to illustrate the scale of disproportionate use vs. land footprint
By accepting flawed metrics that ignore return flows and localized land footprints, Utah is forfeiting its water security to feed a narrative of scarcity that ignores the basic mathematics of its own land use and hydrological return.
[under construction: helping people see that it is over-allocation to lower basin states NOT any type of long term, unprecedented climate crisis that is causing scarcity in the Colorado River.]
.
.
Colorado River Statistics: (NOTE 70% OF COLORADO RIVER WATER IS USED FOR CROP IRRIGATION!)
About the Colorado River
The Colorado River: ○ supplies water to 40 million people in the U.S. and Mexico; ○ irrigates nearly 5.5 million acres of land; and ○ is a water source for 30 federally recognized Tribes.
Nearly 70% of Colorado River water use is for agriculture
The Colorado River basin (“basin”) is divided into an Upper and Lower Basin at Lee Ferry, AZ.
The Upper Division States of Utah, Colorado, New Mexico and Wyoming receive Colorado River water, as do the Lower Division States of Arizona, California and Nevada (collectively, the “Basin States”).
Nearly 90% of Colorado River water originates in the Upper Basin.
The Colorado River is approximately 1,400 miles long and the basin is approximately 250,000 square miles.
The “Law of the River” refers to the body of laws, regulation and policy that governs Colorado River operations.
The 1922 Colorado River Compact (“1922 Compact”) is the cornerstone of the Law of the River.
The River’s Track Record
The Colorado River system has experienced frequent cycles of drought and recovery throughout its history.
Although Colorado River hydrology has been impacted by drought and climate change since 2000, over the past century the river, together with storage, have provided sufficient water in both wet and dry cycles to meet established uses and compact requirements.
The Upper Division States have historically supplied and received credit for Colorado River flows to the Lower Basin in excess of their 1922 Compact obligations.
Allocations and Obligations
Basin States
The primary purpose of the 1922 Compact is “to provide for the equitable division and apportionment of the use of the waters of the Colorado River System.”3
The compact allocates the exclusive beneficial consumptive use of 7.5 million acre-feet of water annually to each basin. o 1928 Boulder Canyon Project Act allocated to each Lower Division State a fixed portion of the Lower Basin’s apportionment
1948 Upper Colorado River Basin Compact (“1948 Compact”) apportions to each Upper
Division state a fixed percentage of the supply available to the Upper Basin in any given
year and 50,000 to the state of Arizona.
The 1922 Compact provides that the “States of the Upper Division will not cause the flow of the river at Lee Ferry to be depleted below an aggregate of 75,000,000 acre-feet for any period of ten consecutive years (the “non-depletion obligation”).
The 1922 Compact also provides that “present perfected rights to the beneficial use of waters of the Colorado River system are unimpaired by this compact.”8
In the event the Upper Basin cannot meet its non-depletion obligation under the 1922 Compact and curtailment of Upper Basin uses becomes necessary, the extent of curtailment by each Upper Division state shall be in the quantities and at the times determined by the Upper Colorado River Commission in accordance with the 1948 Compact.
Each state will then determine how water users subject to its jurisdiction will be required to help meet the state’s curtailment obligation
Utah will administer curtailment within the state in accordance with Utah law and under the regulation of the State Engineer.
Mexico
The United States committed 1.5 million acre-feet of the river’s annual flow to Mexico under the 1944 Mexican Water Treaty.
The 1922 Compact also requires satisfaction of Mexico’s Treaty entitlement. Tribal Water Rights11
Tribal water rights are assessed against the Colorado River apportionment of the state in which the Tribe’s lands are situated.
Developing River Water
The Lower Division States have the right to develop and beneficially use their respective allocations of the 7.5 million acre-feet of Colorado River water apportioned to the Lower Basin..
The Upper Division States have the right to develop and beneficially use their allocated percentages of the supply available to the Upper Basin after deducting Arizona’s 50,000 acrefeet allocation.
The compacts were expressly developed to ensure that faster growing states would not be able to claim all available Colorado River water.
Utah’s Colorado River Allocation, Current and Future Use
The 1948 Compact allocates Utah 23% of the Upper Basin available supply
27% of all water used in Utah comes from the Colorado River.
Utah’s future water plans incorporate the impacts of climate change, extended drought and reduced natural flows in the Colorado River.
Potential future/proposed development o Tribal water right settlements in the Upper Basin Navajo Nation: 81,500 acre-feet (2015 Agreement and 2020 Settlement ratified by Congress) Ute Indian Tribe: 144,000 acre-feet (Court Decree) and potential for additional 115,000 AF (1990 Compact ratified by Congress in the 1992 Central Utah Project Completion Act legislation and Utah. Tribe has yet to ratify) o Municipal and Agricultural Uses Additional municipal and industrial uses are contemplated within Utah’s compact allocation
https://utahgeology.com/wp-content/uploads/2026/02/image-13.png1200978Lance Weaverhttps://utahgeology.com/wp-content/uploads/2025/07/utah-geology-site-logo-420px-new.pngLance Weaver2023-06-17 18:12:002026-02-25 20:10:48Historic Great Salt Lake Levels & Colorado River Water Scarcity (& How They Lie to You)
Although my degree is in geology & geophysics, and not nuclear or astrophysics, I’v always had a keen interest in physics and would love to go back to school one day and get a graduate degree somewhere in that field. My advanced physics, geochronology and geophysics classes in college really interested and excited me. At just the age of 19 as I went through school I was flooded with the following ideas and insights and had strong impressions of where modern physical understandings were lacking.
As the internet grows I have found I am far from alone. Through the previous 20 years I’ve seen that numerous scientists are thinking about and trying to solve these same issues and independently coming to the same conclusions as I have. Because there are so many others, I am quite sure these issues will work themselves out over time. I think collaborative, academic bodies will eventually move our global understanding where it needs to be in order to fully understand the concepts my theories are working toward. In relation to my very unique theory for minor periodic true polar wandering and the relativity of radiometric dating, I will go over some of the basic principles of what I think mainstream science will one day mathematically & experimentally prove for certain.
Outline of Concepts (click to expand)
Outline
1. There are many poorly understood cycles in celestial mechanics, some of which affect many of the fundamental units of physics.
(give examples)
-what really is mass? how does it relate to time?
-what dictates nuclear stability and decay rates?
2. One of the most basic of these is the sun’s 11 yr solar cycle of solar maximum. This poorly understood cycle, which is almost certainly caused by a type of electrical resonance between the sun and Jupiter (and Saturn), reverses the sun’s electromagnetic field and causes massive electrical discharges and changes within the sun’s dynamo.
(give examples)
-sun and Jupiter are a binary pair, Jupiter’s period is ~11 years.
-they create a double circle resonance. when closest, their lines intertwine. Saturn & Jupiters 11 year orbit somehow drive the ~11 year solar cycle.
-also…
3. Many of the celestial mechanic principles which govern the orbits of bodies are still sometimes explained using archaic concepts of Newtonian mechanics. Understanding phenomena such as inertia, circular orbits, and mass/gravity in terms of quantum field mechanics helps to better explain the relativity and connectedness of our galaxy.
(give examples)
-the similarity between charge and gravity equations (force related to distance squared).
-The circular orbital behavior of a charged particle in a mag field.
-The standing wave and orbit of the earth.
-diagram of how the earth would create a mag field if it is a charged particle in a large oscillating mag field of the sun.
-channeled sources teach of 8 dimensions, a fractal analog is the 8 energy shells in atoms. this is where energy goes.
-speed of light (core atomic resonance of that frequency) dictates the dimension. it is dictated by the mag field of the next higher governing creation.
-throw in the concept of the sun or all matter being a vortex into the next dimension (like a drain sucking in matter & blowing out energy)
4.The galactic core, and many other systems within the universe also produce harmonics and orbital resonances (especially with gravity waves), which create cycles affecting our solar system and all bodies within the universe. The density waves which create our spiral arm geometry is an example. The most pertinent cycle for our solar system is a 600-800 yr & 3000-4200 year cycle which radically affects our sun and solar system.
(give examples)
-we only have mythological historical and channeled accounts to tell us about these theorized cycles.
-It appears to completely disrupt the solar system.
-causes a huge energetic exchange between the sun and its governing power (perhaps the galactic core?).
-The energetic exchanges change the z-number and nuclear stability; which changes most of the relative fundamentals such as mass, density and binding energy.
-Changes occurring during these cycles create changes in volume/density & angular velocity and momentum and are the primary driving force for plate tectonics.
5. Just like suns, every atom is a miniature vortex/whirlpool connecting dimensions. Just as differing densities in the ocean or atmosphere cause vortexes seeking equilibrium (tornadoes/whirlpools), so also are suns and subatomic particles 3D vortices which pull matter from one density/dimension, transform it and blow it into another density/dimension in the form of energy (matter goes in gravitationally and out electromagnetically). Somewhat like a slinky going down the stairs, all matter steps through the dimensions; each sun, planet and atom attracting to itself in one dimension until it dies and is re-created or born again in the next higher dimension. Everything has its analog across the dimensions. As galaxies and humans attract in this life, so we will manifest in the next.
6. The unified field is the master electromagnetic (quantum) field. Particles are simply well behaved ripples or vortices in the quantum field. The Strong, Weak, Gravitational and Magnetic attractive/repulsive forces are all different aspects of the same force–which have to do with alignment or misalignment of the vortices. What needs to be solved is the mechanism which shields some interactions and not others. What shields some elements from being magnetic? What shields the Strong Force in all but nucleic interactions? What shields the “magnetic” forces in celestial mechanics to make interactions behave “gravitationally”? Etc… To solve the shielding problem is to unify the forces. My guess is that the math behind this is beyond our current abilities. I believe it has to do with calculating the composite field interactions between every subatomic vortex in the field.
The cycles of celestial mechanics and their relationship to the fundamental units of physics
In our Galaxy there are many cycles which affect our earth and our measurements of space and time. The most fundamental of these cycles is obviously the earth day, which is essentially a measure one complete rotation of earth on its axis. Also well known are the year, the lunar cycle which months are loosely based on, and the less known Solar Cycle of 11 years where the sun reverses polarity. There are even greater cycles of such long duration that their exact mechanical characteristics are only speculative; such as our solar system’s movement within the Orion arm of the galaxy, our movement up and down across the galactic plane or equator, and our solar system’s orbit around the galactic core. I propose that these larger celestial cycles dictate all of our physical laws and measurements in ways many may not realize. It should be obvious that all our measurements of time are based on the velocity of the earth’s rotation and orbit around the sun, as well as the distance and size of the earth itself and its orbit. For instance, by changing the properties of inertia or the size of earth and/or its speed, you change the length of a ‘year’ and thus the 4.5x billion year date for the age of the earth and the age of everything in our geologic timeline. Einstein and many physicists like him came to realize over a century ago that all these measurements were relative to each-other and were dependent upon one’s reference frame in many complicated ways.
I suggest that there is no way to conclusively prove that the earth’s rotational velocity, orbital velocity or orbital period have been constant; and that in fact historical and mythological records seem to suggest to the contrary. I propose a cosmological model which suggests that our Solar System experiences long periods of relative stability interspersed by short bursts of extreme relativistic changes much like the suns 9-10 years of stable behavior interspersed by 1-3 years of erratic behavior during Solar Max. I suggest that special relativity and gravity waves can be used to suggest that large changes in the angular velocity of our solar system’s orbit in the galaxy, cause minor but significant changes in volume, density and even its mass, binding energy and other energetic properties of physics through time.
Two dimensional representation of the rate of change of Celestial Cycles. Peaks and troughs represent huge gravity waves emanating out from the Galactic Core, which cause short periods of intense change in spacetime, mass, angular velocity, and angular momentum. Areas of constant slope between peaks and trough represent areas of relative stability.
The Solar Cycle and Orbital Resonance
Our sun’s 11 year solar cycle has been well researched and documented. Roughly every 11 years the sun’s magnetic field collapses, reverses and realigns in a process corresponding with Solar Maximum, where the sun’s energetic output, sunspot activity and coronal mass ejection prevalence intensifies. Older models seeking to explain the cause of these cycles relied on classical physics explanations which saw the sun as a closed dynamo system. Newer models are beginning to explore how electro-magnetic and gravitational fields might actually be at play in these phenomena. Although well documented, it is not well known that the Sun and Jupiter are essentially a loose binary system, as the center of gravity of the two bodies lies outside the sun’s circumference. At roughly 1/10th the diameter of the sun, Jupiter is more than twice as massive than all the other planets combined. As Jupiter orbits the sun it tugs the sun toward itself by more than half the sun’s 800,000 mile diameter. The slight acceleration of the Sun’s mass and convective zone fluids created by this binary orbit between the Jupiter, the Sun & Saturn, I believe, creates drives the tidal forces within the sun as well as creating some type of electrical resonance of the two bodies and the entire solar system.
Jupiter’s massive size causes a slight tug on the sun in a binary or near-binary orbit. Their true center of gravity (barycenter) lies just outside the circumference of the Sun.Highly Exaggerated illustration of the binary nature of the Sun and Jupiter’s orbits, showing how orbital speed increases at maximum approach. This relationship could theoretically create an electric resonance which in turn interacts with the galactic field.
Many papers attempting to link Jupiter’s orbit (in combination with other planets) to the suns solar cycle (see Courtillot, 2021 or Stefani, 2019 for instance). However, all of them have been ignored or dismissed as no one has found a mathematical model convincing enough to account for the 0.7 to 0.8 year difference between the two. I contend that there’s absolutely no way that the 11.8 year periodicity of the Jovian orbit is not somehow connected to the 11.1 periodicity of the solar cycle and I suspect the difference in time has to do with a combination of electrical flow of Jupiter and only some planets pairing with Jupiter to affect the Suns internal magnetic flow, or perhaps simple neglect and misunderstanding of the important aspect of Jupiter’s up and down motion across the solar equator on the suns dynamo.
As depicted in the exaggerated illustration above, when these two massive bodies reach perihelion (their closest approach), their angular momentum increases slightly — this acceleration of mass and charge, undoubtedly induces some type of charge. (As a result of gravitational and electromagnetic principles I detail below, I suggest that Solar Max is somehow related to changes in the Sun’s rotational acceleration and not just by inner-body tidal forces caused by heat differentials). Perhaps the Solar Jovian exchange simply enhances or subtly drives the existing flow and imbalances in the sun’s internal dynamo. It is not entirely understood why the sun’s electromagnetic field always rebuilds in a switched polarity, but I suspect that either Jupiter’s orbital obliquity to the Solar Plane (which is 6.01 degrees) actually alternately snakes above and below the celestial equator with each orbit, or it is caused by some galactic influence such as our solar system’s position in the galactic field according to principles which will be discussed later in this article.
Although not well explored by astrophysicists, the above gravitational influences between Jupiter and the Suns magnetic field, internal producing plasma currents are fairly straight foreword results of known dynamo processes. However, I believe there are more non-Newtonian electrical influences of this Solar/Jovian movement that warrant further exploration. Particularly, the electrical current exchange between the sun and Jupiter following a Jupiter/Io model, as well as possible ulta-subtle gravity waves cased by the Jupiter’s acceleration of the sun.
Many ancient cultures have legends of a cataclysmic time cycle with a periodicity of catastrophe approximating 4.5-7,000 years. The Hindu Yuga, the Mayan Baktun and the Hebrew/Christian calendar are just a few examples. Although mired in myth, perhaps these legends are based on some type of subtle astronomical cycle.
Galactic Gravity Waves and their Possible Effects on our Sun and Earth
The small Gravity Waves theorized to possibly be caused by the sun’s acceleration and the electrical resonance created by the same process is extremely relevant in our discussion because I believe it serves as a microcosm or fractal of what is occurring in the Galactic Core. The dance or movement of these two bodies creates an alternating, radiating field disturbance which radiates throughout the and Galaxy and ends up affecting the gravitational and electrical properties of all smaller bodies. I believe it is this same phenomena occurring in our Galactic core which is responsible for the “arms” of our Galaxy, and more importantly, creating alternating regions or arms of high energy density and low energy density, (which also regulate the relativistic changes of many cosmic variables for our solar system such as inertia and gravity). Much like with the famous double slit experiment, this double wave interference pattern creates linear node alignments which radiate out from the center like sunbursts or spokes on a wheel. When the oscillating source of these interference waves is itself rotating, then the spokes become curved arms matching the ratio phi—just like we see in our galaxy. (see cosmometry.net for many amazing insights into the relationships of phi)
Understanding the gravity waves which likely shape our Galaxy. (take special note of the content near time 4:30)
As our solar system slowly moves through the pattern of electromagnetic waves and gravity waves emanated out from the galactic core, many fundamentals of physics change. Large gravity waves fold space-time on itself, causing relative changes in mass, density, inertia and solar energy output. I propose that rotating binary bodies in the center of the milky way are creating a wave pattern similar to those demonstrated in the experiments below. This pattern contains both reinforcing waves and canceling waves. Matter in the galaxy tends to get pushed into and congregate in the ‘arms’ which are composed of canceling waves (both gravitational waves and electromagnetic waves). However as earth moves through these regions of reinforcing waves and canceling waves, the very fundamentals of physics change.
Imagine these oscillating balls representing the Sun and Jupiter (or similarly the Galactic Core & Sagittarius A East). Note the double interference pattern (especially the wave canceling “rays” or spokes radiating from the center). Now picture the entire system rotating and you would get the same condition existing in the Galactic core—it being responsible for the spiral arms of our Galaxy. Matter tends to be driven into the “quiet” or wave-cancelling arms.As the two massive bodies rotate, the double interference pattern spirals out from the center, creating arcs matching the arms of our galaxy.
Watch a sort of binary pair or star orbiting Sagittarius A at the center of our Milky Way Galaxy. (starting at minute 0:50) Could this motion be responsible for the arm structure of the Galaxy? Could it be creating a pattern of waves which affect the earth on a periodicity of several thousand years and be responsible for true polar wandering events on earth?
Celestial Mechanics and a Unified Field Theory
Although containing four or more fundamental forces, science seems to be marching on in finding ways to explain the unified field that Einstein envisioned. There are many patterns and concepts concerning a possible unified field which any high school student can see, and in fact most college textbooks actually point out. Modern String theory is starting to validate previously pseudoscience “new age” theories that require multiple dimensions to make things work. Here, we’ll first cover the similarities in equations which govern classical vs. quantum mechanics. For an over simplified example, take for instance the similarities between law of universal gravitation and Coulomb’s law.
Universal Gravitation vs. Coulomb’s Law
It should be obvious that there seems to be a distinct relationship between mass and charge. This relationship becomes more clear and insightful when we look closely at mass and compare it to the effects of a charge in different types of magnetic fields. Mass, by definition is simply a measure of the force it takes to break inertia and accelerate an object. But what causes the effects of inertia? This force is often seen as separate from electromagnetism, but remember the Lorentz force laws show that it takes a force to move charged particles against a magnetic field. To those who have looked closely into magnetic field vectors on a spherical object, the results are amazingly similar to the inertial effects we see on objects in our Solar System. Although strikingly similar on the surface, mathematically proving this idea that inertia is actually caused by the resistance of magnetic fields on relatively “charged” objects has proven elusive (but that doesn’t mean it won’t be done one day). Before moving into the more complex differences between gravity and magnetism let’s take a moment to look at the similar effects of planetary orbits and the behavior of a charged particle moving normal to a magnetic field. In introductory physics we learn of the cyclotron and the effects of a charged particle when traveling normal to a uniform magnetic field. As shown in the illustrations below, the particle will be forced into a circular orbit when the velocity is inversely proportional to the charge. Doesn’t this look amazingly similar to planetary orbits? Isn’t this a better explanation for why planets tend to stabilize their orbits around the celestial equator and galactic bodies tend to do the same along the galactic equatorial plane? It likely also plays a role in why planets with weak or no magnetic fields often have very small or no moons.
Questions: -Electromagnetic properties only act on oppositely charged objects. Is there any way to test whether the sun and its planets are relatively opposingly charged? –
similarities between the circular or ‘cyclotronic” motion of a charged particle moving normal to a uniform magnetic field, and the stable orbit of a planet or satellite orbiting within the uniform magnetic field of its governing celestial body.
Some cosmological phenomena are sometimes still explained using entirely newtonian physics principles, despite their amazing similarities to electromagnetic principles. There are many physicists trying to break out of this old mechanical cosmological view and trying to see the universe as a dynamic electrical system. One profound aspect of this is the idea that Celestial bodies may be heated from within by induction caused by motion through the solar or galactic magnetic field, just as a conductor induces a current when it moves through an alternating field. If such were at all true there could be many implications on possible periodicities of volcanism and the speed of tectonic movement (orogenic events) seen in the geologic record. Perhaps as many ancient myths suggest, the movement of our Solar System in and out of high density “nodes” of the Galactic Field could possibly influence planetary heating, plate subduction and Solar output.
Our current difficulty in getting past the prevailing classical astronomical models is reminiscent of the 17th century scientific community led by Lord Kelvin who had trouble accepting the idea of radioactivity playing a role in the Sun’s and earth’s interior heating.
A changing magnetic field through a conducting ring induces a current. Accordingly, the sun’s & galaxy’s changing magnetic field induces a current in the earth, initially controlling its internal dynamo and its seemingly random switches in polarity.
Understanding how Jupiter’s moon Io proves the electrical effects of planetary bodies and may be the best model for many of the volcanic effects we see on earth through the late Mesozoic to mid Cenozoic on earth.
Putting it all together
Putting the principles we have been discussing together I propose a model in which, just as a wound conductor wire acquires an induced current when moved through an oscillating magnetic field, the Sun also is subtly influenced electrically by its motion through the galactic magnetic field. Changes in the Sun’s acceleration, like those caused by Jupiter’s binary perigee every 11 years, cause electrically induced surges manifest as solar max. The same process is repeated up and down the line between Suns, planets and other orbiting satellites which have cores appropriate for forming dynamic magnetic fields. Thus the earth’s core also has a current which is induced by its travel through the sun’s oscillating magnetic field. (However, hardened planets like earth contain largely “frozen” magnetic fields which are no longer able to flow easily with the changes of their “governing” stars.) Energetic changes in earth’s internal dynamo are also caused by accelerations caused by our own satellite (The earth and moon are also a binary system). This process forms a chain which transfers energy and other aspects of electrical resonance from the smallest of celestial bodies, to the galactic core itself. Of course, like most things in nature there are obviously myriads of exceptions and complexities which seem to break the rules of every model. A scientists job is not to lay on the wisdom as if they have “figured nature out”, but to propose theories and hypotheses which explain natural phenomena and invite others to test and challenge those theories in search of truth….
The Larmor Precession causes atoms to process just like the earth. I propose the same principles act upon the earth causing the precession of the equinoxes
Understanding the Relationship Between PHI & Solar Max
I need to explain here how the alignment of Jupiter, Saturn & Neptune are responsible for the 11.3 solar max and reversal of the suns electromagnetic field. It has to do with the bipole of the binary like action these planets create as they pull the sun in directions opposing the greater galactic field (a microcosm to what happens each 3300 years when it changes directions in its spiral orbit. The thing to understand here, is that astronomers who have explored the sun/Jupiter-Saturn-Neptune alignment are looking for a straight line when they should be looking for PHI. PHI is a straight line imposed on bent space time. And its related to the way that tension waves & gravity work on ‘circular motion’ or rotating bodies as seen in the below video!
Oversimplified principles of electromagnetic dynamics within the Solar System and Galaxy.
Questions: -If true would the motion of the sun through the galactic magnetic field, or the motion of the planets through the suns magnetic field create a drag? Wouldn’t this tend to slow them down over time? –
Atomic Orbital Shells Are Analogs to the Dimensions
Just as different atoms have different numbers of energy shells, so might different planets and suns have different numbers of densities. (string theory refs).
periodic table of the elements showing the electron shells of each element.
We like to think of electrons as ‘particles’ orbiting ‘around’ the nucleus, but in reality electron shells are more like an energy field which holds a discrete amount of energy. The number of shells and amount of energy those shells can hold is determined by the “core vibration” or mass of the nucleus. Likewise the varying dimensions of planets (such as earth’s heavens) or even the 7 energy bodies in hindu belief are often referred to as existing ‘around’ a person or planet, but in reality pinpointing these shells in space is not so straightforward. In the ‘Law of One’, Saturn’s 7th dimension is referred to as existing in the “rings’ of Saturn, just as Oahspe and most mainstream religions refer to earth’s heavens or resurrections as existing within the earth’s electromagnetic field. This is true in a manner of speaking because space/mass expands as it becomes more energized, but one needs to realize that these places are truly alternate dimensions invisible to human eye and manifesting only as light or energy when translating from one reference frame to another.
-put diagrams of gravity vs electromagnetic interactions. -lay out relationships between fundamental physical properties (mass, energy, etc) -lay out a framework for how core vibrations change, and how this change then dictates the fundamental laws.
—- UNDER CONSTRUCTION —————————————————————————————–
Things to Add to Article....
Summary
Most of the fundamental units of physics are relative to many cosmological factors which change over time. The earth’s volume, density, and most importantly the speed of light, … are relative to the solar system’s position in the galaxy. Assumptions claiming these do not changed are flawed…
We are just beginning to understand the electrical nature of the universe. The relationship between electromagnetism and gravity is in its infancy. Most physics textbooks point out these relationships as examples of what is yet to be discovered… when we find these relationships, we will understand why decay rates change over time.
Small description of the 8 dimensions from cosmology article. As earth moves between these, dates skew.
(give examples)
-the similarity between force and gravity equations (over distance squared).
-The circular orbital behavior of a charged particle in a mag field.
-The standing wave and orbit of the earth.
-diagram of how the earth would create a mag field if it is a charged particle in a large oscillating mag field of the sun.
-the lost energy we call binding energy, is pulled to the next dimension
-(main point) most importantly hit on the possible causes for creation of, and polarity switches in magnetic fields. because switches (which have collapses) or changes in mag field intensity, affect radiation on earth, which affects decay rates.
-gravity and electromagnetic attraction are obviously the same force, but the force is dampened or accentuated by the configuration of the atoms in the material. In materials which conduct electricity, the force gravitational force is greater… that’s why they are heavy. It has to do with how the atoms are arranged…
different theories for what changes the decay rates…
1.standing wave nodes
2.abrupt change in velocity
3.(main point) direct CME impacts and general changes in solar and interstellar radiation reaching the earth. Current physics is still a bit too caught up in particle physics, but we understand radiation enough to realize that interstellar radiation both creates and affects radioactive particles. Creation of C14 by highly charged solar particles is well understood. Creation of other radioactive isotopes like U245 and K37 from cosmic sources is less understood, but the principles are still there.
4 -PLATE TECTONICS. as you move further away from a gravitationally governing body, an object’s volume and density change. A bag of potato chips of a mountain or a balloon in the air will expand the higher they raise away from the earth. The planets experience the same effect in relation to the sun’s gravitational influences. As a you move away from the Sun, planets become more voluminous and less dense (depending on the rigidity of their materials). Scientist currently assume that the differences in planetary density were determined as they all simultaneously condensed with our sun (which may certainly be true) and that the earth has not changed its location in the solar system. My theory however suggests that it is changes in interstellar density, which is the main driver of plate tectonics. The liquid core expands & shrinks as we cross major galactic density boundaries, the rigid crust, less so. The same would be true of our sun (and its planets) as we move about in relation to both the galactic core and other galactic gravitational influences (they move slightly closer or further from the sun).
This process is quantized, not simply gradational. It could best be compared to the water cycle. Water does not transform from ice to liquid to steam in a linear fashion, it does so in quantized steps involving latent heat. With water, changes of state are determined by the energy density of the liquid or the density/pressure of the environment. If you slowly move most frozen substances into a region of lower pressure, they will liquify unless you take enough energy out of the system to bring equilibrium. As our Solar System moves through the galaxy, the same type of thing happens as we pass through nebula (and clouds of dark matter) of differing density. Scientist know that the orbit of earth & all the planets in our solar system (as well as the moon) are slowly expanding, but no one can agree on why. What is yet to be seen is the effect of this change on the laws of physics once the quantized threshold boundary is crossed…
5-UNIFIED FIELD THEORY. gravity and magnetism are not separate forces, but different intensities of the same force. as scores of people have suggested, there is only one force, and it is subatomically created by reinforcing or cancelling waves. (Essentially vibrations or vortices in the quantum field.) Waves which are essentially electric field lines caused by space-time vortices in the unified field. Whats important is the idea that attractive and repulsive forces of electromagnetism act on every object. It is well understood that it is the “alignment” of the atoms which dictates magnetism. What is not well understood is that it is those same atomic alignment characteristics which determine mass… which in turn determines what we call gravity. Magnetic materials are almost universally heavy (more massive). Why? Because the alignment or polarization of the atoms also makes them more attracted to the earth than other materials (in addition to being attracted to other magnetic materials). Iron, water or air do not have different masses because they have more or less atoms, it is because of the alignment or polarization of the atoms. Density is not so much a measure of the molarity (number of atoms) but the proportion of atoms aligned in certain configurations or ways. The reason solids can pass through liquids or gases is the same reason why dimensions don’t interact, its because of the configuration and/or base vibratory frequency of the atoms. At the most fundamental level, there is no such thing as a solid or “particle”. Things simply behave like particles because of their electrical properties
———————————————————————————
-when the moon had a liquid core and stronger magnetic field, it likely caused the earth’s magnetic field to regularly flip in the same way Jupiter causes the sun to. Possibly certain galactic variables re-melt the core and polarize it from time to time. Or like dropping a magnetic can affect its magnetism, jolts to the earth may affects its magnetism as well.
#1 Unified field theory. I believe we one day will come to mathematically and conceptually understand how all fundamental forces (gravitational, electromagnetic, strong, & weak force) are simply different distortions of the same unified force & field. I believe the key to finding these formulas is in understanding the multidimensionality of matter. (7 dimensions in our galaxy, just like there are 7 possible electron valence shells or energy levels in an atom.)
#2 Total relativity. All fundamental units of physics are relative and change as a body progresses through these dimensions. Mass, inertia, bonding energies/strong forces, gravitational forces, electromagnetic forces and time all are relative and change as a reference frame moves through the dimensions. Changes occur proportionally according to the mathematical relationships proven by mainstream physics. My ideas essentially mirror special relativity with exception that the speed of light is discretely different in each of the 7 dimensions.
UNDER CONSTRUCTION ——————————————————————————————————-
Changes In Fundamental Rules of Physics
I’ve come to realize our current understanding of the motion of our Solar System through the galaxy is fairly retarded. We really have only 200-600 years of good astronomical data to use as a basis for tracking our motion. That’s not very much and not nearly enough to really be able to say much about our galactic orbit. All of our astronomical calculations concerning the suns movements are blind projections of current movements. We know from current measurable motions of stars that our planet wobbles on its axis. We know it also has a slight binary orbit because of the moon. We know the sun does the same and has a true binary orbit with Jupiter (the center of which exists outside the circumference of the sun). We know our solar system is inclined relative to the galactic plane while moving toward it and we speculate it snakes its way up and down through that plane over time. Despite presumptuous and prideful speculation, we really don’t have enough data to speculate as to exactly how that orbit behaves over thousands of years. Vague Greek records (and possibly a few Chinese & Babylonian ones) are our only truly reliable way of extending astronomical conditions a bit longer into the past. The language barrier with Babylonian and Egyptian records makes them hopelessly suspect. What is causing the earth’s magnetic field strength (and other planets in our solar system) to decay more rapidly than linear predictions suggested? It must have to do with the galactic orbit.
How reliable is projecting current motions millions of years into the past or present? I suggest that although equally as suspect, using material supposedly channeled from other dimensions where longer astronomical records exist is really all we have to work with. From these, I speculate that as our solar system orbits the galactic core the earth moves through differing energy densities in the galactic wind. I suspect it is a combination between our location in the galaxy and the angle between our suns trajectory in relation to the prevailing galactic field that dictates the speed of light and atomic energy potential in our solar system.
Variables affecting our planet and their relationships.
earth’s axial tilt = season/surface heat, electromagnetic interaction, harvest productivity
earth’s speed = time of day, length of year,
earth’s distance from sun = seems to be somehow loosely related to density/mass/size of the planet.
Variables affecting our solar system and their relationships.
solar system’s axial tilt = heat/intensity of the sun, electromagnetic interaction, spiritual harvest productivity
solar system’s speed = time in some way?
solar distance from galactic core = doesn’t matter so much, what matters is our relationship to the interference patterns.
The speed of Light dictates the dimension
I put a lot of meditation into this.. I need to find a way to explain it. basically matter’s core vibration is what dictates a dimension and that is based on the speed of light. The speed of light is different for each dimension. Each reality or illusion is formed by being able to interact with (see and touch) matter. Both seeing and touching matter has to do with electromagnetic waves bouncing off things and repulsive interactions between atoms. “Atoms” are mostly empty space, but the “solidity” of energy patterns that we call atoms or matter is dictated by them both having an equal core vibration. So atoms or the matter in each dimension, vibrate at the same frequency which is the speed of light.
—————-
I reference the Law of One because it is seems to verbalize many of the ideas that I have felt since delving into physics. As a second witness to my thoughts, it gives more validity to the hope that my ideas are not solely my own. It seems to me that there are a lot of people working on these concepts and that a scientific consensus will eventually be achieved which will iron out all the errors and inconsistencies in my own and other pioneering theories.
I believe that the correct model for multi-dimensionality in the universe must take into account the accumulating metaphysical evidence for life after death, and the existence of beings which dwell in dimensions not visible to our own. I believe along with many major religions and supposed material channeled from unseen realms that the earth is approaching a dimension boundary. And as we slowly cross this boundary, the changes we see in the fundamentals of physics will help our understanding of the physics of our galaxy to greatly enlarge.
#1 There is a dualistic dimension or metaphysical realm.
There is a metaphysical realm, dream state, spirit world, purgatory, time/space, mental environment or inner planes which is a duality or opposite in many ways to the physical world. (Separate from the resurrected realms, atmospherea/4rth density, etc. It is essentially the 8th density, next octave or dwelling place of God/ Higher Self. “The conditions are such that time becomes infinite and mass ceases”.) Time as we know it does not exist there. Where in our dimension space is large and curved compared to ourselves (the earth is spherical), there time is large and curved. Here, if you travel around our sphere/globe you will return to the space where you started; there if you travel around that sphere you will return to the time where you started. Here we move through space at will, but cannot control movement through time; there you can travel through time at will, but cannot control movement through space.
#2 There are 7 primary dimensions or densities in our galaxy which religion and metaphysics call the resurrected realms/heavens or glories and are a projection of the metaphysical realm. The reality or illusion of these realms is created by differing discrete values for the speed of light. The seven energy levels or valence shells of an atom are a fractal or microcosm of this greater reality.
Energy vibratory rates are quantized into discrete octaves of existence. In our octave, energy vibratory rates are quantized into 7 discrete steps of the continuum. Much like light being shown through a prism creating the 7 colors of the rainbow, energy originates in an octave above our own and is projected through the metaphysical realm to create the 7 densities or realms of existence. The speed of light is constant for our 3rd dimension or density, but is different in each of the other dimensions.
#3 The same principles Einstein’s relativity theories suggest apply to objects as they approach the speed of light also apply to a “stationary” object’s core vibratory rate. Generally when an object absorbs energy, it eventually burns up or disintegrates. On a molecular scale, the energy causes the atomic bonds to break down, the energy transforms into kinetic energy and the particles become excited releasing light (electromagnetic field energy) and gases which rise in the air to join other particles of like energy and density.
We suggest the strong force or bonding energy is created by a harmonic standing wave which emanates from the protons of the nucleus. This standing wave is the “core vibration” of the atom (see http://quantumwavetheory.wordpress.com/)
Questioner: Were these constructed in time/space or space/time?
Ra: I am Ra. We ask your persistent patience, for our answer must be complex.
A construct of thought was formed in time/space. This portion of time/space is that which approaches the speed of light. In time/space, at this approach, the conditions are such that time becomes infinite and mass ceases so that one which is able to skim the, boundary strength of this time/space is able to become placed where it will.
When we were where we wished to be we then clothed the construct of light with that which would appear as the crystal bell. This was formed through the boundary into space/time. Thus there were two constructs, the time/space or immaterial construct, and the space/time or materialized construct.
Ra: I am Ra. Although this query is difficult to answer adequately due to the limitations of your space/time sound vibration complexes, we shall respond to the best of our ability.
The hallmark of time/space is the inequity between time and space. In your space/time the spatial orientation of material causes a tangible framework for illusion. In time/space the inequity is upon the shoulders of that property known to you as time. This property renders entities and experiences intangible in a relative sense. In your framework each particle or core vibration moves at a velocity which approaches what you call the speed of light from the direction of superluminal [faster than the speed of light] velocities.
Thus the time/space or metaphysical experience is that which is very finely tuned and, although an analog of space/time, lacking in its tangible characteristics. In these metaphysical planes there is a great deal of what you call time which is used to review and re-review the biases and learn/teachings of a prior, as you would call it, space/time incarnation.
The extreme fluidity of these regions makes it possible for much to be penetrated which must needs be absorbed before the process of healing of an entity may be accomplished. Each entity is located in a somewhat immobile state much as you are located in space/time in a somewhat immobile state in time. In this immobile space the entity has been placed by the form-maker and higher self so that it may be in the proper configuration for learn/teaching that which it has received in the space/time incarnation.
Depending upon this time/space locus there will be certain helpers which assist in this healing process. The process involves seeing in full the experience, seeing it against the backdrop of the mind/body/spirit complex total experience, forgiving the self for all missteps as regards the missed guideposts during the incarnation and, finally, the careful assessment of the next necessities for learning. This is done entirely by the higher self until an entity has become conscious in space/time of the process and means of spiritual evolution at which time the entity will consciously take part in all decisions.
Understanding the solar dynamo http://astrogeo.oxfordjournals.org/content/45/4/4.7.full
Electric Field on Earth http://hypertextbook.com/facts/1998/TreshaEdwards.shtml
Power Density of Solar Radiation http://hypertextbook.com/facts/1998/ManicaPiputbundit.shtml
Of Particular Significance http://profmattstrassler.com/articles-and-posts/particle-physics-basics/the-known-forces-of-nature/the-strength-of-the-known-forces/
https://utahgeology.com/wp-content/uploads/2022/07/1.45.10-Electric-universe.jpg14221978Lance Weaverhttps://utahgeology.com/wp-content/uploads/2025/07/utah-geology-site-logo-420px-new.pngLance Weaver2022-07-24 23:21:172025-04-29 13:43:15Is the Orbit of Jupiter related to Solar Cycles and How Gravity Waves & Electrical Properties Affect the Earth and Shape the Arms of the Milky Way Galaxy
The Vishnu schist is part of the Vishnu complex in the exposed basement rocks of the Grand Canyon region. This metamorphic layer was formed by the intrusion of plutonic masses from under the crust and the deposit of sediment from an eroded mountain chain.
The oldest rocks in the Vishnu complex are deposits of hornblende and quartz that were laid down around 1.8 billion years ago. These rocks were originally part of a deep ocean trench, and they were subsequently overlain by sediments now known as the Brahma schist, which was laid down 1.75 billion years ago. Within a few million years of the Brahma schist deposit, volcanic activity added the felsic rock of the Rama schist. Together, these layers comprise the Vishnu schist that serves as the basement of the entire Grand Canyon area.
Schist is a metamorphic rock type that is commonly formed by the pressure of overlying sediments over a period of millions of years. The rocks of the Vishnu schist are typical of their type, having elongated minerals that can easily be separated into flakes. Some igneous rock is present in the Vishnu complex, though it represents an intrusion that took place considerably later than the original sediment deposits.
The oldest rocks within the Grand Canyon are exposed within Granite Gorge aria are characteristically dark somber gray. They respond to erosion to form a steep-walled V-shaped gorge (Text-fig. 56) through which the Colorado River flows from Mile 77 downstream to beyond Phantom Ranch, These (lark colored rocks are evidence of extensive deformation, during which they were subjected to intense heat and pressure and the effects of fluids and gases. The original sedimentary or volcanic characters have been extensively modified and in some cases obliterated. Early Precambrian rocks are not stratified but possess a planar structure known as foliation, resulting from reorientation of platy minerals, crystals, and grains in response to deformation. Foliation throughout most of Granite Gorge is nearly vertical which contrasts with the horizontal stratification of the overlying younger rocks.
Three major rock bodies are found within the Early Precambrian complex. The first encountered on the river trip consists of metamorphosed sedimentary rocks in which some relict. sedimentary structures are preserved. This body of baked and altered rocks is known as the Vishnu Schist and is exposed downstream beyond Hance Rapids to near Zoroaster Canyon. They represent part of the older rocks of the earths crust. Very little detailed information can be gained about their environment of deposition since the original character of the rock has been nearly completely obliterated.
Downstream from Zoroaster Canyon is a sequence of metamorphic rocks which differ in composition, color, and texture from the Vishnu Schist but superficially appear similar to it because of their degree of metamorphism, These rocks are known as the Brahma Schist and probably represent metamorphosed volcanic rocks. Numerous granitic dikes have intruded into both the Vishnu and Brahma schists. Most of these dikes are nearly vertical and parallel to foliation of the schists and stand out in marked contrast to the metamorphic material. Rocks of the dikes are characteristically pink, light colored, and composed of large interlocking crystals of feldspar and quartz, many of which are over a foot in diameter. These intrusions become very numerous in many areas and in some localities make up more than 50 percent of the rock body. Near Zoroaster Canyon dikes are particularly common and one large massive intrusion is dissected by the canyon.
Large granite bodies of the Inner Gorge are referred to as the Zoroaster Granite and represent a period of igneous activity after deposition and metamorphism of both the Brahma and Vishnu Schists but before deposition of the overlying Grand Canyon Series and Paleozoic formations.
The Vishnu Schist in the upper part of the gorge contains many pink pegmatite dikes. Many units within the schist are well foliated and may appear similar to a gneiss. Locally, relict bedding can be seen indicating a sedimentary origin. Foliation is nearly vertical. The gray-green walls of the Vishnu Schist are crisscrossed by dikes of granite. The ragged, ledgy, V-shaped character of the inner gorge is evidenced downstream.
The Granite Gorge Metamorphic Suite consists of lithologic units, the Brahma, Rama, and Vishnuschists, that have been mapped within the Upper, Middle, and Lower Granite Gorges of the Grand Canyon. The Vishnu Schist consists of quartz–mica schist, pelitic schist, and meta-arenites. They exhibit relict sedimentary structures and textures that demonstrate that they are metamorphosed submarinesedimentary rocks. The Brahma Schist consists of amphibolite, hornblende–biotite–plagioclase schist, biotite-plagioclase schist, orthoamphibole-bearing schist and gneiss, and metamorphosed sulfide deposits. As inferred from relict structures and textures, the Brahma Schist is composed of mafic to felsic-composition metavolcanic rocks. The Rama Schist consists of massive, fine-grained quartzofeldspathic schist and gneiss that likely are probable felsic metavolcanic rocks. On the basis of the presence of relict pillow structures, interlayering of metavolcanic strata, and the large volumes of metavolcanic rocks, the Brahma and Rama schists are interpreted to consist of metamorphosed, volcanic island-arc and associated submarine volcanic rocks. These metavolcanic rocks are locally overlain by the metamorphosed submarine sedimentary rocks of the Vishnu Schist that are interpreted to have accumulated in oceanic trenches. These metasedimentary rocks were originally composed of particles of quartz, clay, and volcanic rock fragments that have become metamorphosed into various schists. The Vishnu Schist exhibits relict graded beddingand structures indicative of turbidite deposits that accumulated in oceanic trenches and other relatively deep-marine settings. The Brahma Schist has been dated to about 1.75 billion years ago. The felsic metavolcanic rocks that comprise the Rama Schist have yielded an age of 1.742 billion years ago
Early Paleoproterozoic basement
The oldest rocks that are part of the Vishnu Basement Rocks is the Elves Chasm pluton. It consists of metamorphosed mafic (hornblende-biotite tonalite) and intermediate-composition plutonic rocks (quartz diorite). Within it, there are tabular amphibolite bodies that might be dikes, that have been dated at about 1.84 billion years ago. It is regarded to be an older granodioritic pluton that was exposed by erosion prior to being buried by the original volcanic and submarine sedimentary rocks of the Granite Gorge Metamorphic Suite. The Elves Chasm pluton is likely part of the basement rocks on which the original volcanic rocks and sediments of the Granite Gorge Metamorphic Suite were deposited.
The highly tectonized contact between Elves Chasm pluton and the Granite Gorge Metamorphic Suite is exposed near Waltenberg Canyon, in 115-Mile Canyon, near Blacktail Canyon, and in the Middle Granite Gorge. This contact is characterized by a high-grade orthoamphibole-bearing gneiss. This gneiss is interpreted to be a highly metamorphosed and sheared paleosol and associated regolith that originally consisted of several meters of weathered rock debris eroded from older plutonic rocks.
I’m a bit heartbroken as day five in the search for five year old Jerold Williams comes to a close, his body was recovered just hours ago.
I spent a good part of days three and four looking for him, and headed home as storms again moved into the area and made the already slim chances of finding the five year old alive, even slimmer. As I was out alone in the dense forest searching for this child, I gave a lot of thought to what could have been done better in his search (and what I would do if this were my child). I think the number one take home point was mobilize as many volunteers as quickly as possible, and do not let anyone under 16 be alone anywhere in the deep woods–always use a buddy system. Nine year old David Gonzales who went missing in Big Bear California was a grisly reminder to how predators can silently steal away a child without any sound, less than 50 yards from watching parents. (His remains were finally discovered almost a year later, less than a mile from where he went missing in an assumed mountain lion predation). Twelve year old Garrett Bardsley who went missing the same summer in the Uinta Mountains, likewise teaches us that not even older boys are immune from getting lost and never being found in cold, wet weather.
.
A few of the mistakes I consider in retrospect.
Because of legal and bureaucratic considerations, as well as worries that volunteer efforts would interfere with dog searches and air support, volunteers were not called for, and actually turned away in the early stages of this search. Because it rained the evening this boy went missing– this was a huge mistake. All scents were destroyed and air support was stifled by inclement weather. Thick forest cover also made air support & thermal imaging useless in many areas. Volunteer and search mobilization was very slow, and because of the rain, may have been the difference between life and death in this event.
Hundreds of volunteers came from the boys Colorado City community by late day two & three, but nearly all of them congregated at the base camp. It became muddy, overly congested and may have made things more difficult for search agencies. No perimeter camps were set up, and very few ventured more than a mile away from the congested base camp. Really, no-one camped away from base camp.
It was easy to be overly optimistic in the first day or two of the search. Because of an optimistic feeling that he would be found, I believe searching was not as thorough, and volunteers were not properly dispersed or valued.
I saw no visible central command tent. Because of this it was hard to tell who was in charge, or where to get the most up to date and reliable information. There was also no real central media outlet for updates, and no human connection to inspire volunteerism outside of the Colorado City community. Because of this only 200-400 searchers participated, when 2,000-3,000 would have been far more effective.
.
Suggestions for possible future searches.
-Seek help as soon as possible. But don’t let search agencies completely take over the search. They have legal considerations (especially with liability for searcher they call/control) and bureaucratic considerations which dictate their actions (especially in calling for volunteers and setting up dispersed camps). Go to the media and call for volunteers, and lead the effort which coordinates volunteer efforts with the efforts of the search agencies involved. Law enforcement understandingly often dissuades volunteerism because it distracts from their important efforts. A Father, brother or family friend MUST step up and direct/coordinate all volunteer efforts. He needs to set up a command booth and get volunteers directed & dispersed. There needs to be two heads who work side by side; one for law enforcement and search agencies and one for excess volunteers (those above and beyond what search agencies need or are legally willing to be responsible for). If law enforcement insists that volunteers stay out of the initial search perimeter, they should be directed to search just outside of it. Remember Brennan Hawkins of Bountiful who was found after 4 days by one of nearly 3,000 volunteers in the Uintas. (Garrett Bardsley’s disappearance the year before played a big part in inspiring the huge community outreach– mobilized largely by the Garrett Bardsley Foundation). At the same time an uncoordinated free-for-all such as the famous Dennis Martin case, needs to be avoided.
-Search and Rescue will typically set up a 2-5 mile radius parameter. But the volunteer effort should focus on manning the outskirts of the perimeter with volunteer campers by the first night. Search parties tend to all congregate at the base camp (usually the place child was last seen). This creates congestion and complicates the efforts of search agencies. If possible the perimeter should consist of forest roads, cliffs, rivers or fences. Send 20-50 volunteers to set up camp all along this perimeter and remain as long as needed. Noisy generators and lights should be encouraged. Also (if it can be negotiated with S&R), send volunteers strategically into the search area (as soon as possible) to set up small dispersed backpacking camps (with fires at night if permitted by forest service regulations). Have them set up their tents and lay out sleeping bags before doing any searching. These not only will give the child a greater chance of finding searchers, but will also serve to scare off opportunistic predators such as bears and mountain lions. With any luck they might come back from a search to find the missing child in one of their sleeping bags. Be sure each site is manned by 2-4 people, encourage volunteers to always use the buddy system and always leave some people at the camp area while sending others back to base camp for periodic updates.
-I have yet to read an account of a ‘lost in the forest’ Utah child who was found dead or alive by dogs or thermal imaging equipment. These tools may be useful but they should not preclude the use and placement of volunteers within the search area. Do not allow search agencies to restrict volunteer efforts on account of these tools. Family must press law enforcement to allow them to do this (if not the first night then the second or third after dogs have been through the area). If dogs or trackers can’t find him in the first day, don’t place much faith in them. I’d love to be proven wrong on this, but I’ve yet to see any solid research showing that search dogs are more than 10% effective, and that thus it’s a fruitful practice to keep volunteers out of the search area for fear they might interfere with the search dogs job.
-Ask for trail runner volunteers the first day. Find very fit teams who can jog the most likely routes from the center point (point of last contact) to the search perimeter. (Make sure they have whistles and bear mace) These runners could also travel between the dispersed camps to carry news.
-The one who goes for help needs to help create Google Map marked with base camp and a designated search perimeter to be given to the media. They should immediately create a webpage or Facebook page with maps, and accurate up-to-date information. (Use a digital map with offline capability like ArcGis?) The mom or close friend should be encouraged to talk to the media quickly and often–as the more human connection you can make with people the more volunteers you will get. Someone also need to make a few hundred copies of the map with search parameters and bring it back to base camp to distribute to volunteers. Some volunteers can be urged by the media to ride ATV’s on trails outside of the search perimeter, in the unlikely event that the child hiked farther away from base camp than anyone suspects. Supply line volunteers can also be asked for to provide food and water to search personnel. An update should be passed two or three times daily from the field search leads to the home media and website contacts. The more information you can get people, the more volunteers you can get—and the more effective they will be. Have someone post links to the search website/facebook page on media article and law enforcement pages.
-Helpful details to get from the family and provide to possible volunteers via the webpage media. What direction did they most likely head (where they playing north, south, east or west of camp previous to going missing). Has the child been taught what to do when getting lost and what is their disposition (are they more likely to stay put or try and find their way out)? How fit is the child (is it common for them to hike several miles or are they more likely to slowly saunter in circles)?
-if no helicopters are available, use drones if possible?
-A printout should be provided for volunteers from the webpage or Facebook page and base camp with some guidelines. It should include 1) Coordinates to base camp and where to go for instruction. 2) A list of oft-overlooked things to bring such as bear spray/mace, whistle or blow horn, flashlight, first-aid kit, compass.
-Once volunteers are mobilized the trick is getting them organized. Search agencies will want two to four large search lines (with 20-30 people each) who will sweep out from the point of last contact and thoroughly comb the designated areas within a mile or two of base camp. But someone needs to organize smaller search groups (3-6 people) who hike the backcountry and do quick sweeps of the more remote regions sweeping in from the parameter camps.
-Speed is of the essence! By day two cold conditions and hypothermia can bring loss of consciousness or make lost people do irrational things. Resist the urge to be optimistic to the point where things that could have been done, aren’t done.
-By day three or four volunteers need to be told to look in trees with large branches and under pine bows and other cover where predators are likely to stash or bury their prey.
-It is important for well thought-out checklists of things to do to be created, before an emergency like this. As illustrated in Atul Gawande’s book “The Checklist Manifesto”, professionals such as airplane pilots and surgeons have been found inevitably to make mistakes in high stress situations unless a checklist exists which can help them remember and practice what they already know. Gawande’s research team has taken this idea, and developed a safe surgery checklist, and applied it around the world, with staggering success.
-I need to create a mockup web page, map and hand-out with step by step instructions that could be used as a template for a search situation. This boy may had lived had he been found earlier. With the skyrocketing increase in tourism of Southwestern Utah’s forests this situations may become more prevalent. Perhaps it would be helpful to create a few brochures, training curriculum or even some training videos to pitch to the dept of public safety or the FCAOG (Five County Association of Governments for Southwest Utah), who work to coordinate resources for local sheriff’s offices.
-When possible, equip even young children with survival items in a back-pack, when hiking in the woods. Including a laser pointer or small LED light, a whistle, a thin poncho or garbage bag with a hole cut in it. Teach them the two essentials, stay warm and stay put. Teach them they should only move if it is needed to stay warm. If they must move to find shelter in order to stay warm (ie. from rain), they need to build arrows to show where they went.
example of a map showing base camp, search perimeter, perimeter camps, and high priority search areas.
https://utahgeology.com/wp-content/uploads/2015/08/example-map.jpg7721322Lance Weaverhttps://utahgeology.com/wp-content/uploads/2025/07/utah-geology-site-logo-420px-new.pngLance Weaver2015-08-10 15:16:422015-08-10 15:16:42Take Away Lessons from my Experience with the Jerold Williams Search
Post Formats is a theme feature introduced with Version 3.1. Post Formats can be used by a theme to customize its presentation of a post.
Lorem ipsum dolor sit amet, consectetuer adipiscing elit. Aenean commodo ligula eget dolor. Aenean massa. Cum sociis natoque penatibus et magnis dis parturient montes, nascetur ridiculus mus – more on WordPress.org: Post Formats
https://utahgeology.com/wp-content/uploads/2015/05/Iceland-Volcano-Lava-Flow.jpg9601440Lance Weaverhttps://utahgeology.com/wp-content/uploads/2025/07/utah-geology-site-logo-420px-new.pngLance Weaver2011-03-28 21:13:112011-03-28 21:13:11Post Formats is a theme feature introduced with Version 3.1. Post Formats can be used by a theme to customize its presentation of a post.
https://utahgeology.com/wp-content/uploads/2025/07/utah-geology-site-logo-420px-new.png00Lance Weaverhttps://utahgeology.com/wp-content/uploads/2025/07/utah-geology-site-logo-420px-new.pngLance Weaver2010-05-07 15:43:442010-05-07 15:43:44A Post without Image