Historic Great Salt Lake Levels & Colorado River Water Scarcity (& How They Lie to You)
How They Lie to You
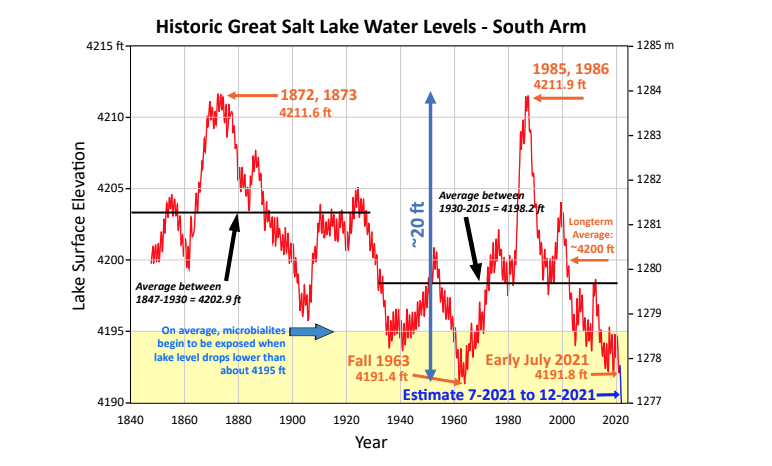
Recently the New York Times did an article on the Great Salt Lake, titled “The Great Salt Lake Is Drying. Can Utah Save It?” In this piece of propaganda disguised as a scientifically based article, they showed a chart of “historic levels of the Great Salt Lake”, which misleadingly started in 1980’s at the lakes historic high-stand and ended in the present levels. The chart, much like the article, purposefully left off any mention of how lake’s levels just a few decades prior to the 1980’s were just as low as those today. It, like much of the media propaganda lately, misleads uninformed readers into thinking climate-change had caused some sort of unprecedented crisis. The same type of dishonest tactics are also often used to promote a false narrative of Colorado River scarcity which obfuscate the true problem of over-allocation and special interest propaganda. (Mostly from international privatized irrigation conglomerates in California & Arizona, spreading disinformation under shell companies cloaked as environmental groups).
Later in this article we’ll detail some of these International and US big money conglomerates and how they manipulate the narrative to make more money at the expense of ignorant political servants or the unwitting public.
Great Salt Lake Background
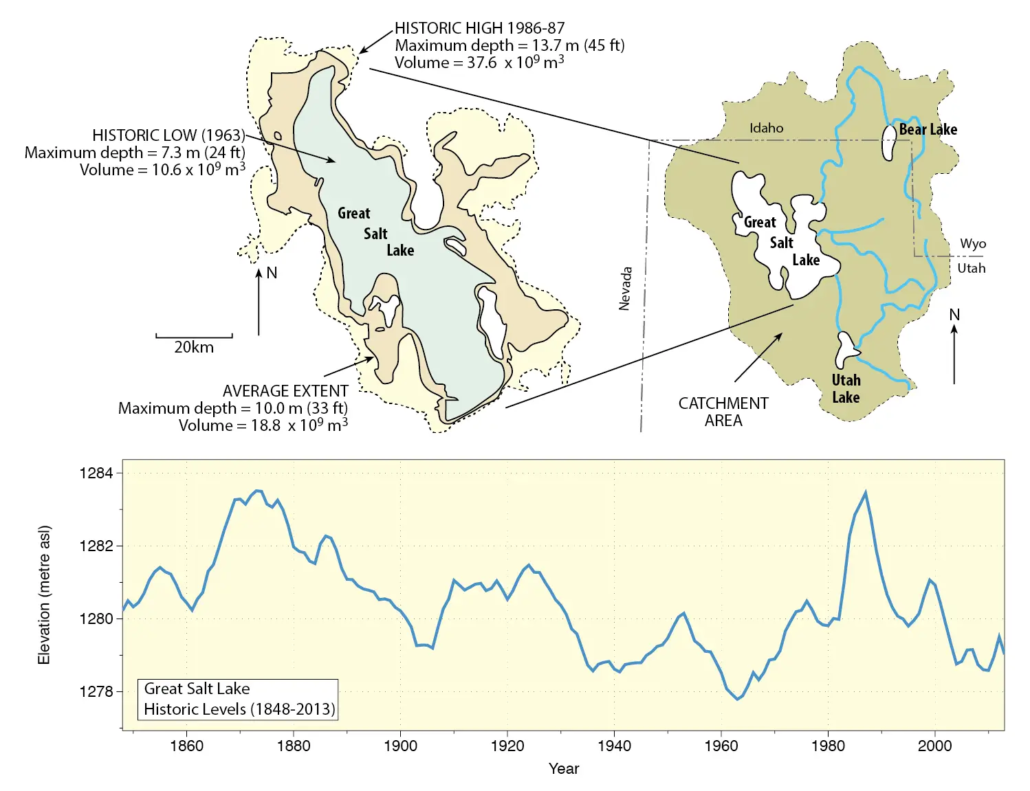
The Great Salt Lake, located in the northern part of the U.S. state of Utah, is the largest saltwater lake in the Western Hemisphere and the eighth-largest terminal lake in the world. As a terminal lake, it has no outlet; water leaves only through evaporation, leaving behind concentrated minerals and salts. It is a remnant of the prehistoric Lake Bonneville, which at its peak covered roughly 20,000 square miles of western Utah and reached depths of 1,000 feet.
Today, the statistics of the lake are as fluid as its shoreline. While its average surface area is approximately 1,700 square miles, this figure can vary by thousands of miles depending on the water level. The lake is remarkably shallow, with an average depth of only about 14 to 15 feet. Its salinity ranges from nearly fresh at the river inlets to roughly 27% in the North Arm—nearly nine times the salinity of the world’s oceans.
Historical Hydrology and the 1960s Baseline
The history of the Great Salt Lake is defined not by stability, but by dramatic, oscillating cycles. Since formal record-keeping began in the mid-19th century, the lake has been a barometer for the climate of the Intermountain West. Contrary to modern narratives that suggest a linear decline, the historical data shows a series of “low-water” events followed by massive recoveries.
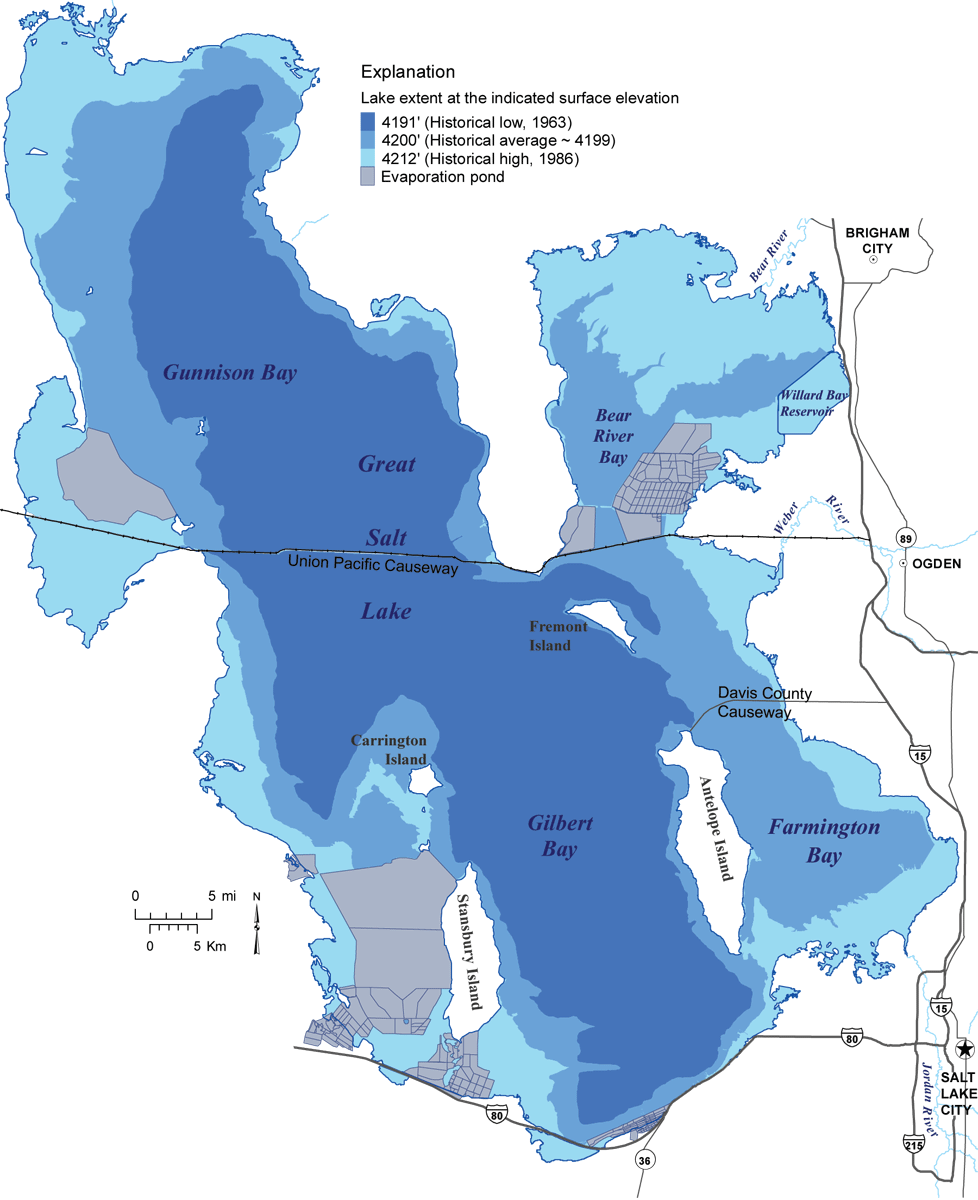
In the mid-1860s, early settlers and explorers noted significantly low levels as the region experienced a period of prolonged aridity. By the early 1900s, specifically around 1905, the lake again dipped to concerning levels that prompted local discussions about the lake’s potential disappearance. However, the most significant historical benchmark occurred in the 1960s. In 1963, the Great Salt Lake reached what was then its lowest recorded level in history, dropping to an elevation of approximately 4,191.35 feet above sea level.
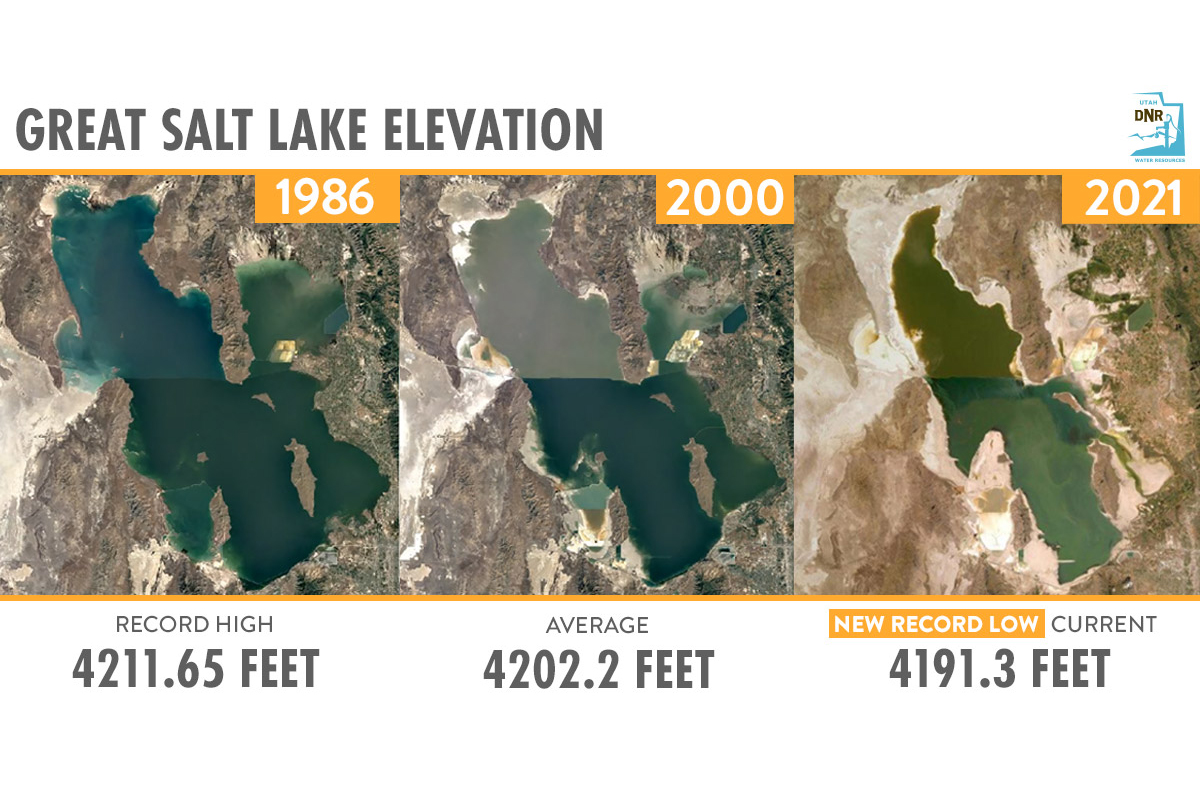
At that time, much like today, there were fears that the lake was in a terminal state of recession. Yet, only twenty years later, the cycle reversed with unprecedented ferocity. By the mid-1980s, the lake rose so rapidly and so high (reaching 4,211.6 feet in 1986 and 1987) that it caused hundreds of millions of dollars in damage to infrastructure, railways, and interstate highways, necessitating the construction of the multi-million dollar “West Desert Pumping Project” to move excess water out of the basin.
Sensationalism vs. Historical Fluctuations
In recent years, the Great Salt Lake has again reached levels that match or slightly exceed the lows of 1963. While this is a significant hydrological event, the framing of these levels by modern media outlets and environmental organizations often borders on the sensational. By focusing exclusively on a 20- or 30-year window, these outlets frequently present current conditions as “unprecedented” or a “looming collapse” that has never occurred before.
This narrative often ignores or deliberately obscures the fact that the lake has reached these exact depths multiple times in the last 160 years. When organizations with specific political or environmental agendas present the current low levels as a permanent “new normal” caused by irreversible factors, they overlook the demonstrated historical resilience of the basin. The history of the lake proves that “record lows” are not the end of the story, but rather a recurring phase in a long-term hydrographic cycle. By creating a culture of fear, these groups often attempt to bypass nuanced discussions about water management in favor of radical policy shifts, hiding the reality that the lake has always recovered from these cycles in the past.
The Great Salt Lake as a Colorado River Proxy
The Great Salt Lake serves as one of the most reliable and carefully measured proxies for determining the historical and future flows of the Colorado River. Because both the Great Salt Lake Basin and the Upper Colorado River Basin rely on the same primary water source—the winter snowpack of the Rocky Mountains—their hydrological fates are intrinsically linked.
For decades, the same organizations that sensationalize the levels of the Great Salt Lake have applied the same tactics to the Colorado River. The public is often told that the Colorado River is in a state of terminal decline and that reservoirs like Lake Mead and Lake Powell will never again reach capacity. The narrative suggests that the “megadrought” is a permanent shift in the planetary climate that renders historical data irrelevant.
However, the Great Salt Lake suggests otherwise. The lake’s long-term data provides a clear record: periods of extreme low flow and low lake levels are inevitably followed by periods of high precipitation and rapid recovery. If the Great Salt Lake could transition from the “all-time record low” of 1963 to the “all-time record high” of 1987 in just over two decades, it demonstrates that the Intermountain West’s water systems are characterized by high-amplitude volatility, not linear exhaustion.
The Great Salt Lake stands as a physical rebuttal to the claim that current low levels in the Western water systems are unprecedented or final. Just as the lake “disappeared” in the 1860s, 1905, and 1963 only to return with a vengeance, the hydrological history of the region suggests that the Colorado River flows will eventually follow the same path of recovery. The lake is a reminder that in the West, the only constant is change, and the most dangerous mistake a researcher can make is to mistake a cyclical low for a terminal end.
How Utah is Getting Screwed Out of Its Colorado River Allocation
Despite the cyclical resilience of the region, Utah is currently allowing itself to be cheated out of its rightful annual allocation of the Colorado River. This systemic loss is driven by a fundamental failure in water accounting: the state fails to properly calculate and credit the “return flows” of water used in its diversions. In the rigid accounting of the Colorado River Compact, Utah is often charged for the total volume of water diverted, rather than the “consumptive use” which represents water actually lost to the system. This ignores the reality that a significant percentage of water used for irrigation or municipal purposes eventually returns to the river system via surface runoff and groundwater recharge, effectively subsidizing the lower basin states at Utah’s expense.
The physical data supports the conclusion that Utah’s actual footprint on the river is far smaller than administrative figures suggest. According to a 2024 study published in Nature (“A database of all major water diversions in the Upper Colorado River Basin“), there are 1,358 major water diversions in the upper river system. Of these, Utah accounts for only 101—the vast majority of which are concentrated on reservation lands in the Uinta Basin. It is hydrologically improbable that these few, localized diversions are permanently removing the massive volumes of water currently calculated in the state’s usage reports. The state is being held to a standard of “permanent withdrawal” that fails to account for the cyclical return of that water to the downstream flow.
Furthermore, a comparison of irrigated agricultural land across the basin states reveals a stark imbalance between supposed usage and actual land footprint. While California and Arizona manage millions of acres of intensive, year-round agriculture within the basin, Utah’s irrigated acreage in the Colorado River basin is a mere fraction of that scale. The stats simply do not add up: Utah is credited with using a disproportionate amount of its allocation despite having significantly fewer diversions and less irrigated land than its neighbors. By accepting these flawed metrics, Utah is forfeiting its water security to feed a narrative of scarcity that ignores the basic mathematics of its own land use and hydrological return.
Water for Hire: A Summary of Big Money Interests in Colorado River Water
Several private equity, hedge fund-style, and agribusiness investment/capital groups (or their backed entities) own or control large portfolios of irrigated agricultural land—and thus the attached Colorado River water rights—in Arizona and California. These are often structured as conglomerates of LLCs/subsidiaries holding farmland in key districts like the Imperial Irrigation District (IID, CA), Palo Verde Irrigation District, Wellton-Mohawk, Cibola Valley, or Yuma-area projects. Water rights are typically “appurtenant” to the land (senior or priority rights under the 1922 Compact, Boulder Canyon Project Act, and Arizona v. California Supreme Court decree), used for large-scale crop irrigation (alfalfa, vegetables, etc.).
These groups are not traditional “irrigation companies” (e.g., mutual water companies or public districts that deliver water via canals), but they effectively control major blocks of irrigation water through land ownership, leasing to farmers, or fallowing for transfers. They act as major stakeholders in Colorado River issues, influencing or participating in water markets, transfers (ag-to-urban), conservation deals, and related litigation/policy fights over allocations, shortages, and post-2026 guidelines. Big ag users (including these holdings) dominate ~70-80% of lower basin use and feature prominently in state/tribal/federal negotiations and lawsuits (e.g., over transfers, environmental reviews, or priority rights).
Here are the most relevant examples, focusing on public/private status and international ties where applicable:
US-Based but with International Backing or Reach
- Greenstone Resource Partners LLC (private water investment firm, Phoenix/NY ties): Owns or controls thousands of acres via ~25 subsidiaries/affiliates (e.g., GSC Farm LLC, Sunstone Farms LLC) in Arizona, especially La Paz County (Cibola area, directly on the Colorado River) and Yuma County (Wellton-Mohawk Irrigation & Drainage District). Key holdings include ~485 acres in Cibola with ~2,033 acre-feet (AF) of 4th-priority Colorado River water (transferred in a high-profile 2018 deal to Queen Creek, AZ suburb for urban use, yielding ~$14M profit after purchase). They lease land for irrigated farming (alfalfa/cotton) or fallow it for transfers and have board influence in districts like Cibola Valley Irrigation & Drainage District. Backers/ownership: Backed by MassMutual (Massachusetts Mutual Life Insurance, a large US mutual financial conglomerate—privately held by policyholders but with massive capital operations) and its Barings subsidiary; also public pension funds and financing from Rabo AgriFinance (Dutch multinational Rabobank subsidiary—international banking/finance capital). Litigation/stakeholder role: Directly involved—counties (La Paz, Mohave, Yuma) sued the Bureau of Reclamation over the Cibola-Queen Creek transfer’s environmental review; a federal judge ruled it inadequate in ~2024, highlighting precedent risks for more transfers. This makes them a flashpoint in broader ag-to-urban water litigation and policy debates.
- Water Asset Management LLC (WAM) (private NY-based hedge fund/investment firm focused on water assets): Owns 6,000+ acres (via LLCs) in Arizona (Maricopa, Mohave, Yuma, and a major ~12,793-acre/ $100M+ purchase in La Paz County’s McMullen Valley) plus holdings in California’s Imperial Valley (leased/farmed for vegetables/row crops). Some Mohave/Yuma parcels have direct Colorado River allocations. They buy irrigated farmland portfolios, lease to operators (e.g., ties to Elmore family farms in Imperial), and position for water market plays/transfers. Ownership: Private capital group (co-founded by Disque Deane Jr.; former Vidler ties). Investors include institutional funds. Stakeholder role: Advocates for market-based solutions in water-scarce West; part of the investor wave affecting basin-wide negotiations, conservation programs (e.g., IID/System Conservation), and litigation risks over rights transfers.
- Vidler Water Company / Vidler Water Resources (water resource developer): Owns ~2,400+ acres of ag land/water rights in Arizona (La Paz/Maricopa) plus assets in California and other Western states. Focuses on acquiring ag water rights and converting to higher-value municipal/industrial use (including Colorado River-related storage/transfers in AZ). Ownership: Formerly public (Vidler Water Resources, Inc.); acquired in 2022 by D.R. Horton, Inc. (NYSE: DHI, major US publicly held homebuilder—public capital group). Now operates as Horton’s water arm. Stakeholder role: Pioneer in Western water markets; holdings contribute to the private investor presence in Colorado River ag water debates.
- Renewable Resources Group (RRG, aka ReNu or related LLCs like Alphabet Farms/Imperial Farming) (private LA-based investment/developer of water, energy, and farming projects): Controls ~16,000 acres in California’s Imperial Valley—one of the largest private ag landholders there—with associated Colorado River water rights (via IID; Imperial gets ~3.1M AF total, mostly ag). Operates irrigated farms producing alfalfa, vegetables, dates, etc. Previously partnered on Palo Verde Valley (CA) deals involving Colorado River rights. Ownership/backers: Private capital group (founded by Cole Frates/Ari Swiller); partnered with Harvard University endowment (major institutional capital investor) on deals like a 13,000-acre Palo Verde purchase (later sold profitably to Metropolitan Water District). RRG execs serve on Colorado River Board of California. Stakeholder role: Large private user/holder in the basin’s biggest ag water user (Imperial); involved in water trading attempts and policy (e.g., fallowing/transfers).
International Companies (Direct Agribusiness Owners)
These are international (non-US headquartered) public or corporate entities that own/operate their own large-scale irrigated farming operations (effectively irrigation conglomerates) with Colorado River water rights in AZ/CA:
- Almarai Company (Saudi Arabia-based, publicly listed on Tadawul Saudi exchange—publicly held international capital/agribusiness group): Via subsidiary Fondomonte, owns ~10,000 acres in Arizona + ~3,500 acres in California’s Palo Verde Valley (direct Colorado River water for alfalfa irrigation, exported as hay for Saudi dairy). Major water user; operations have faced scrutiny/lease terminations over groundwater but retain private land/Colorado River rights in CA.
- Al Dahra ACX Global Inc. (UAE-based international agribusiness conglomerate): Operates large forage/alfalfa farms in Arizona (La Paz, etc.) and California, using Colorado River or connected water sources. Exports hay; one of the bigger foreign players in Southwest irrigated ag.
These entities (especially the US investment firms) have amassed holdings amid drought-driven water scarcity, enabling profits via land/water value appreciation or transfers. They are “major stakeholders” in the sense that their activities fuel debates, market pressures, and indirect involvement in litigation (e.g., challenges to transfers, environmental impacts, or basin allocation fights between lower basin states, feds, tribes, and ag/urban users). True private “irrigation companies” (canal operators) are rare today—most rights shifted to public districts like IID decades ago—but these groups control equivalent scale through land ownership.
Direct evidence of large-scale donations to media campaigns or formal partnerships with major environmental NGOs (e.g., Nature Conservancy, EDF, American Rivers) is limited or absent in public sources. Instead, they engage in targeted influence, public positioning as “solutions providers,” and policy advocacy that critics view as creating conflicts of interest (profiting from scarcity-driven transfers/fallowing while framing it as conservation/public good).
.
Greenstone Resource Partners (and subsidiaries like GSC Farm/Sunstone Farms)
- Lobbying/government influence via local control: Greenstone’s managing director Mike Malano was elected to the board of the Cibola Valley Irrigation & Drainage District (CVIDD). Landowner voting (2 votes per acre owned) gave them outsized sway in a small rural district. Under their influence, CVIDD amended its federal contract (post-1992) and internal rules (2006–2014) to ease “water exchange, lease, or transfer” approvals without full member votes—setting the stage for their landmark 2018 sale of ~2,033 acre-feet of Colorado River water from ~485 acres in Cibola, AZ, to Queen Creek suburb (Phoenix area) for ~$24M (after buying for ~$9.8M). A district board president leasing from Greenstone publicly supported the transfer in 2019 testimony. This “long-term plan” (per local attorney) enabled the first private brokerage of mainstem Colorado River rights, now under federal court scrutiny for inadequate NEPA environmental review (judge ruled against Bureau of Reclamation approval in 2024; counties sued arguing precedent risks).
- Public positioning/media: Website and exec statements frame Greenstone as “a water company” advancing “transactions that benefit both the public good and private enterprise” and “reliable, sustainable water supplies.” At a 2022 Arizona legislative hearing, Malano described it as “one of the largest farming operations in the state” (downplaying its hedge-fund-style backing by MassMutual/Barings/pension funds). Critics (e.g., La Paz County supervisors) called this “infiltration” of rural towns, comparing it to the Owens Valley grab and warning of rural decline/farm fallowing.
- Perceived conflict of interest: The deal is criticized as greenwashing profit (urban supply) at rural/env expense during drought—opening “Pandora’s box” for more transfers while bypassing broader basin negotiations. Env/farm advocates and counties opposed it as prioritizing Wall Street over communities/river health.
Water Asset Management (WAM)
- Public advocacy for policy reform (market-based lobbying): WAM execs (e.g., legal counsel James Eklund, ex-Colorado water negotiator; co-founder Matthew Diserio) have been vocal in national media (NYT 2021, SLTrib/ProPublica) pushing Colorado River “reform”: commodify water for trading, create private incentives/accounts in reservoirs (e.g., Lake Powell credits from fallowing), and attract private investment/innovation for conservation amid climate-driven shortages. Diserio called U.S. water “the biggest emerging market on Earth” and a “trillion-dollar opportunity.” WAM has done rotational fallowing in AZ to generate credits sold to urban/Lake Mead accounts.
- Ties to legislation: In 2024–2026, WAM’s ~$100M purchase of 12,793 acres in rural La Paz County’s McMullen Valley (alfalfa land) aligns with a proposed Arizona bill (early 2026) expanding rural-to-urban transfers. WAM argues it “saves more water” than current use; Arizona AG has considered suing to block on public nuisance grounds (overpumping/groundwater impacts). This builds on their broader AZ/CA/CO holdings (6,000+ acres) positioned for market plays.
- Public sway: Statements emphasize public-private collaboration to address drought/climate (vs. “use it or lose it” waste).
- Conflicts/env response: American Rivers, farm advocates, and water managers rebutted WAM’s 2021 comments as threatening collaborative basin management, agriculture, and ecosystems—favoring speculation over public solutions. Critics see COI in advocating markets that let them profit from scarcity they help monetize (buy low on distressed ag land, sell high to cities).
Vidler Water Resources (acquired by public homebuilder D.R. Horton in 2022)
- Direct lobbying: Retained Veridus lobbying firm (Arizona). CEO Dorothy Timian-Palmer directly lobbied Central Arizona Groundwater Replenishment District (CAGRD) board/chair in 2018 against a competing $97.5M deal with Gila River Indian Community—arguing Vidler’s stored Colorado River credits (Harquahala/Phoenix areas) were better/cheaper, via calls/emails framing it as “negotiations.” Vidler positioned shortages/drought as “market catalysts” in SEC filings and pitched to state entities (e.g., sold credits to Arizona Water Banking Authority, Scottsdale). They built recharge facilities storing 250,000+ acre-feet, leveraging discounted excess river water rules.
- Public positioning: Emphasized “keeping water in Arizona,” jobs/taxes, and helping development amid growth/shortages.
- Conflicts: No env ties noted. COI perception: Profiting from banking/transferring public river water (invested ~$100M) while competing against tribal/public alternatives, potentially delaying broader conservation.
Renewable Resources Group (RRG)
- Limited public examples: One exec (COO Nicole Neeman Brady) serves on the Colorado River Board of California (state advisory body on river management/negotiations; noted as personal capacity). RRG (with Harvard endowment ties) has done large ag-land deals in Imperial Valley/Palo Verde (Colorado River rights via IID) and previously sold Palo Verde acreage profitably to Metropolitan Water District for urban use. They launched a “Sustainable Water Impact Fund” (and follow-on) framing investments as water sustainability/impact—positioning for conservation-minded capital.
- Operational influence via board role and market deals.
International players (e.g., Almarai/Fondomonte, Al Dahra)
- No evidence of proactive U.S. lobbying or media campaigns for their AZ/CA irrigated holdings. Instead, they face pushback: Arizona AG sued Fondomonte (Almarai subsidiary) in 2024–2026 for “excessive” groundwater pumping as public nuisance (drying wells, sinking ground in La Paz County); state terminated some leases. Focus has been defensive/operational rather than sway efforts.
Overall patterns and COI notes: These firms rarely disclose formal federal/state lobbying spends (private entities; Vidler used hired firms pre-acquisition). Influence is often indirect (local boards, public comments, media quotes) or via proposed legislation benefiting transfers. They sway opinion by branding as efficiency/conservation innovators solving drought (websites, exec interviews)—a framing env groups frequently reject as speculative profiteering that undermines equitable/public solutions and exacerbates rural declines. No major donations to env groups or overt “green” partnerships surfaced (unlike some broader water-market funds by TNC). Critics argue inherent COI: they buy distressed water rights cheap, fallow/transfer for big gains (~$14M+ profits cited), and advocate rules enabling more of the same, while rural communities and basin-wide env priorities bear costs.
Comparative Water Use and Land Footprint
The following table illustrates the disparity between water contribution, administrative withdrawal figures, and the actual agricultural land footprint within the Colorado River Basin.
| State | Water Allotment (AF/yr) | Water Contribution (AF/yr) | % of Total | Total Withdrawal (AF/yr) | % of Total | Agricultural Use (AF/yr) | % of Total | Irrigated Acreage | % of Total |
| Colorado | 3,881,250 | 9,100,000 | 76.0% | 2,500,000 | 20.0% | 2,250,000 | 21.6% | 1,500,000 | 37.2% |
| Utah | 1,725,000 | 1,400,000 | 11.7% | 1,000,000 | 8.0% | 850,000 | 8.2% | 300,000 | 7.4% |
| Wyoming | 1,050,000 | 548,000 | 4.6% | 1,043,000 | 8.3% | 1,043,000 | 10.0% | 300,000 | 7.4% |
| New Mexico | 843,750 | 400,000 | 3.3% | 450,000 | 3.6% | 350,000 | 3.4% | 130,000 | 3.2% |
| California | 4,400,000 | 0 | 0.0% | 4,400,000 | 35.2% | 3,800,000 | 36.5% | 900,000 | 22.3% |
| Arizona | 2,850,000 | 500,000 | 4.2% | 2,800,000 | 22.4% | 2,100,000 | 20.2% | 900,000 | 22.3% |
| Nevada | 300,000 | 25,000 | 0.2% | 300,000 | 2.4% | 15,000 | 0.1% | 5,000 | 0.1% |
| TOTAL | 15,050,000 | 11,973,000 | 100% | 12,493,000 | 100% | 10,408,000 | 100% | 4,035,000 | 100% |
By accepting flawed metrics that ignore return flows and localized land footprints, Utah is forfeiting its water security to feed a narrative of scarcity that ignores the basic mathematics of its own land use and hydrological return.
[under construction: helping people see that it is over-allocation to lower basin states NOT any type of long term, unprecedented climate crisis that is causing scarcity in the Colorado River.]

.
.
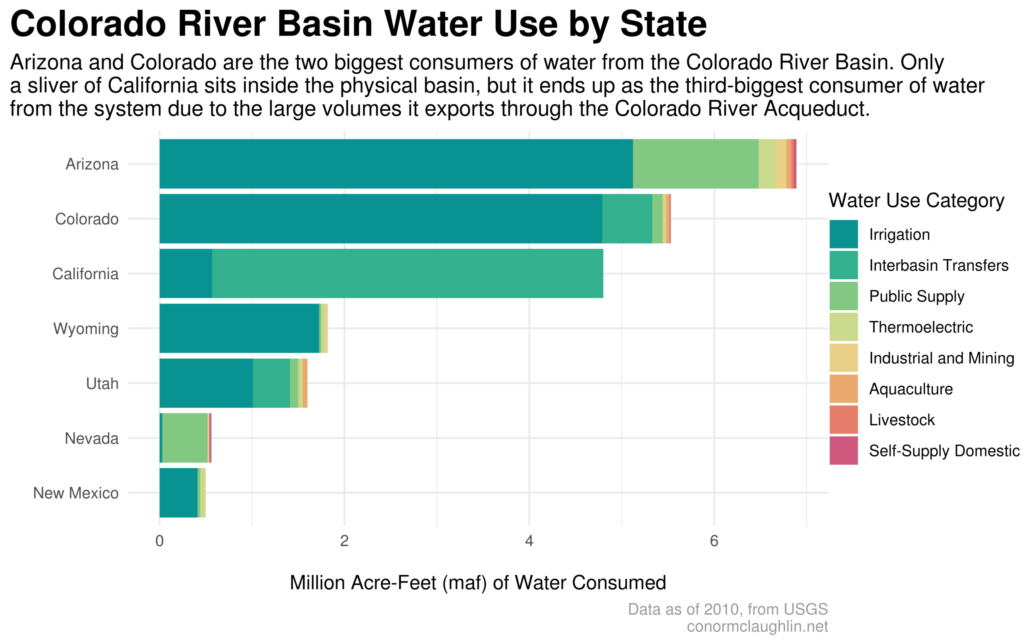
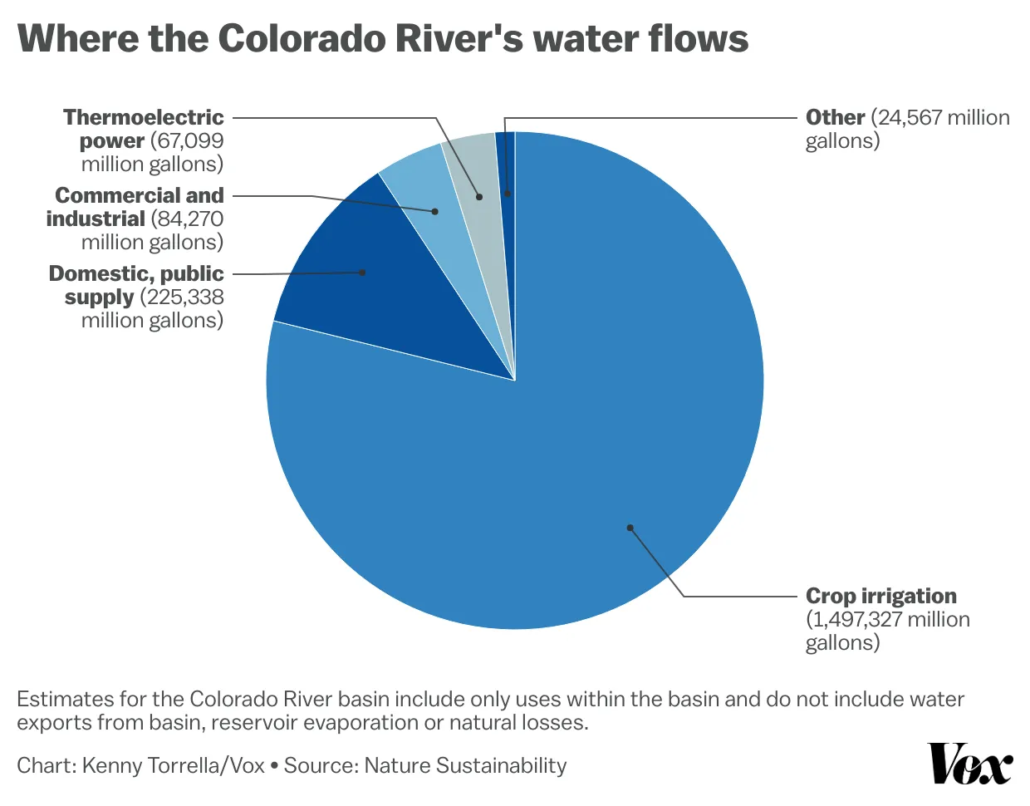
Colorado River Statistics: (NOTE 70% OF COLORADO RIVER WATER IS USED FOR CROP IRRIGATION!)
About the Colorado River
- The Colorado River:
○ supplies water to 40 million people in the U.S. and Mexico;
○ irrigates nearly 5.5 million acres of land; and
○ is a water source for 30 federally recognized Tribes. - Nearly 70% of Colorado River water use is for agriculture
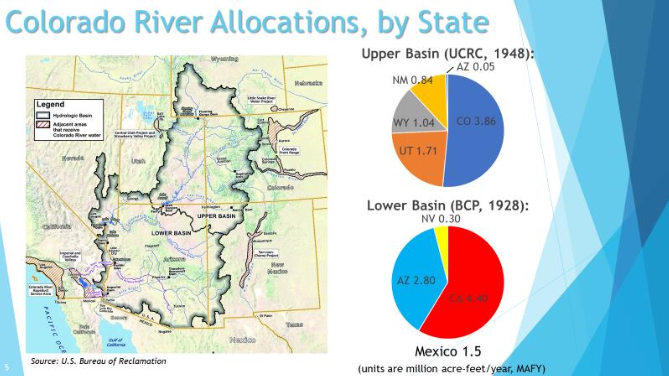
- The Colorado River basin (“basin”) is divided into an Upper and Lower Basin at Lee Ferry, AZ.
- The Upper Division States of Utah, Colorado, New Mexico and Wyoming receive Colorado River
water, as do the Lower Division States of Arizona, California and Nevada (collectively, the “Basin
States”). - Nearly 90% of Colorado River water originates in the Upper Basin.
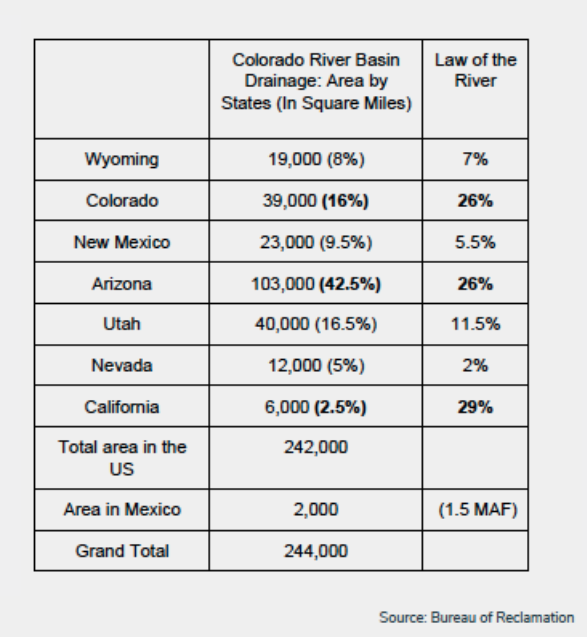
- The Colorado River is approximately 1,400 miles long and the basin is approximately 250,000
square miles. - The “Law of the River” refers to the body of laws, regulation and policy that governs Colorado
River operations. - The 1922 Colorado River Compact (“1922 Compact”) is the cornerstone of the Law of the River.
The River’s Track Record - The Colorado River system has experienced frequent cycles of drought and recovery throughout
its history. - Although Colorado River hydrology has been impacted by drought and climate change since
2000, over the past century the river, together with storage, have provided sufficient water in
both wet and dry cycles to meet established uses and compact requirements. - The Upper Division States have historically supplied and received credit for Colorado River flows
to the Lower Basin in excess of their 1922 Compact obligations.
Allocations and Obligations
Basin States - The primary purpose of the 1922 Compact is “to provide for the equitable division and
apportionment of the use of the waters of the Colorado River System.”3 - The compact allocates the exclusive beneficial consumptive use of 7.5 million acre-feet of water
annually to each basin.
o 1928 Boulder Canyon Project Act allocated to each Lower Division State a fixed portion
of the Lower Basin’s apportionment - 1948 Upper Colorado River Basin Compact (“1948 Compact”) apportions to each Upper
- Division state a fixed percentage of the supply available to the Upper Basin in any given
- year and 50,000 to the state of Arizona.
- The 1922 Compact provides that the “States of the Upper Division will not cause the flow of the
river at Lee Ferry to be depleted below an aggregate of 75,000,000 acre-feet for any period of
ten consecutive years (the “non-depletion obligation”). - The 1922 Compact also provides that “present perfected rights to the beneficial use of waters of
the Colorado River system are unimpaired by this compact.”8 - In the event the Upper Basin cannot meet its non-depletion obligation under the 1922 Compact
and curtailment of Upper Basin uses becomes necessary, the extent of curtailment by each
Upper Division state shall be in the quantities and at the times determined by the Upper
Colorado River Commission in accordance with the 1948 Compact. - Each state will then determine how water users subject to its jurisdiction will be required to help
meet the state’s curtailment obligation - Utah will administer curtailment within the state in accordance with Utah law and under the
regulation of the State Engineer.
Mexico - The United States committed 1.5 million acre-feet of the river’s annual flow to Mexico under the
1944 Mexican Water Treaty. - The 1922 Compact also requires satisfaction of Mexico’s Treaty entitlement.
Tribal Water Rights11 - Tribal water rights are assessed against the Colorado River apportionment of the state in which
the Tribe’s lands are situated.
Developing River Water - The Lower Division States have the right to develop and beneficially use their respective
allocations of the 7.5 million acre-feet of Colorado River water apportioned to the Lower Basin.. - The Upper Division States have the right to develop and beneficially use their allocated
percentages of the supply available to the Upper Basin after deducting Arizona’s 50,000 acrefeet allocation. - The compacts were expressly developed to ensure that faster growing states would not be able
to claim all available Colorado River water.
Utah’s Colorado River Allocation, Current and Future Use - The 1948 Compact allocates Utah 23% of the Upper Basin available supply
- 27% of all water used in Utah comes from the Colorado River.
- Utah’s future water plans incorporate the impacts of climate change, extended drought and
reduced natural flows in the Colorado River. - Potential future/proposed development
o Tribal water right settlements in the Upper Basin
Navajo Nation: 81,500 acre-feet (2015 Agreement and 2020 Settlement ratified
by Congress)
Ute Indian Tribe: 144,000 acre-feet (Court Decree) and potential for additional
115,000 AF (1990 Compact ratified by Congress in the 1992 Central Utah Project
Completion Act legislation and Utah. Tribe has yet to ratify)
o Municipal and Agricultural Uses
Additional municipal and industrial uses are contemplated within Utah’s
compact allocation

